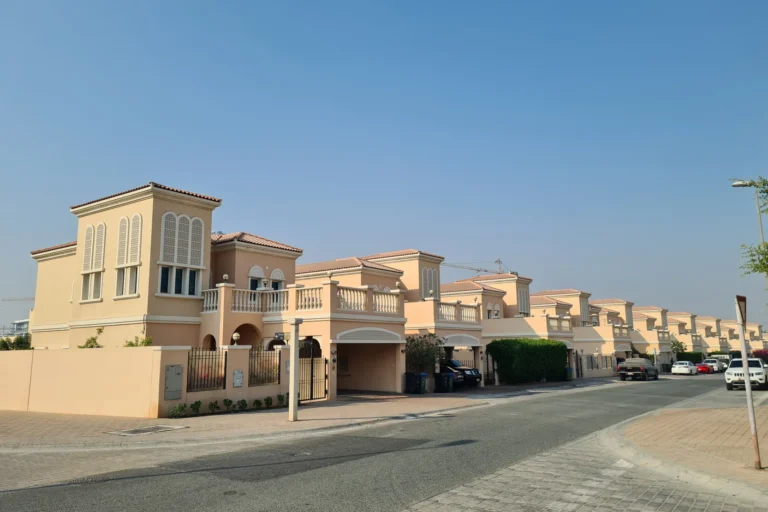
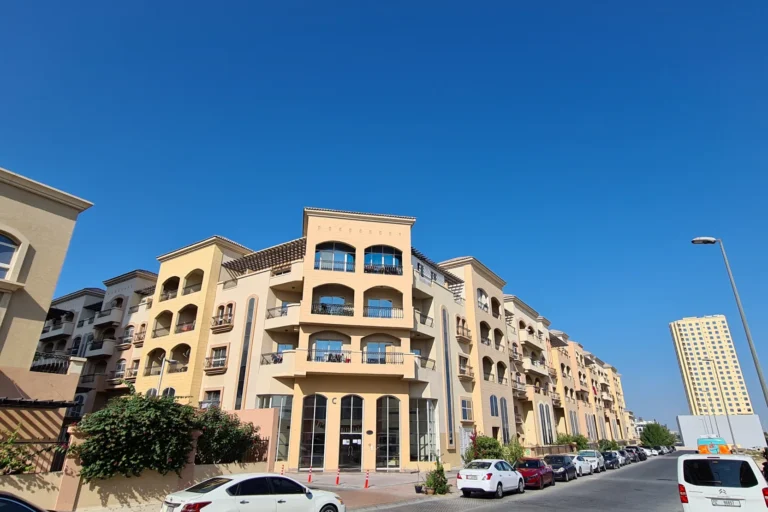
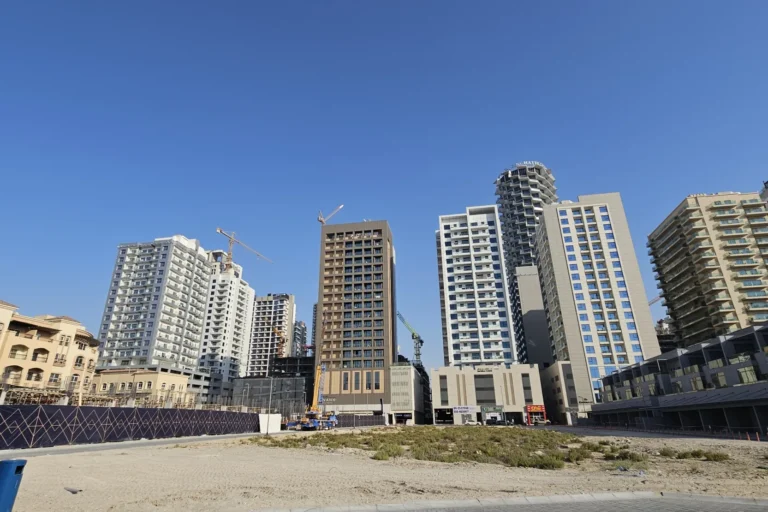
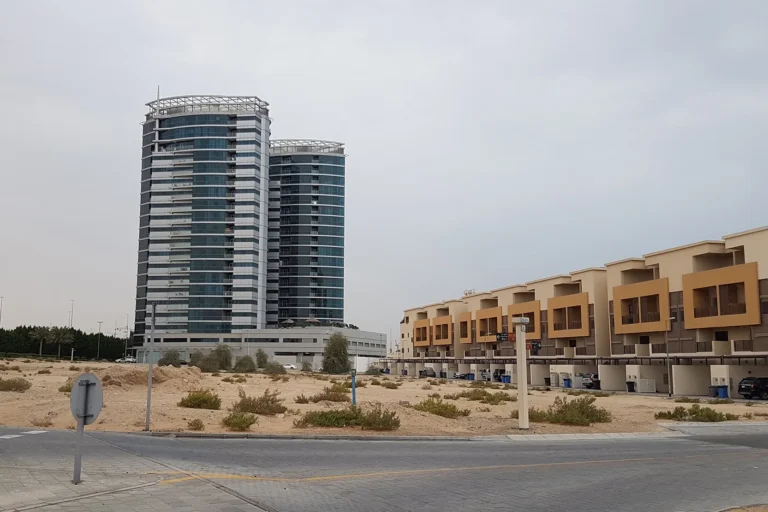
Al Barsha South 2 is a district of Dubai, 8 listings available with us.
Al Barsha South 2 is a named subcommunity within the Al Barsha South area of Dubai. Located at coordinates 25.072576 N, 55.225647 E, it sits on the western side of the wider Al Barsha district and functions primarily as a residential neighbourhood within the city’s suburban ring. Official records show 50 sale transactions registered for Al Barsha South 2; travel times from the community to central destinations are moderate, reflecting its position between Dubai’s inland hubs and the coast.
Al Barsha South 2 is classified as a subcommunity of Al Barsha South. It is positioned within Dubai’s urban fabric so that the most commonly visited commercial and leisure destinations are within a short-to-moderate drive. The community is included in location indexes under the broader path Dubai, Al Barsha, Al Barsha South and is referenced on local property portals and government land-record summaries as a distinct sector of Al Barsha South.
The nearest Dubai Metro station in official listings is on the Red Line (station code R33). The straight-line or mapped distance to that station is recorded as 5,852 metres; this distance is not classified as walkable. Road travel times quoted for the area are approximately: 19 minutes to Dubai Mall, 13 minutes to Palm Jumeirah, 16 minutes to Burj Al Arab and 17 minutes to The Walk JBR. Airport access by road is commonly estimated at about 24 minutes to Dubai International Airport (DXB) and about 30 minutes to Al Maktoum International Airport (DWC) depending on traffic conditions.
Distances from Al Barsha South 2 to major Dubai points (approximate, by road or common reference):
Al Barsha South 2 is named and tracked in property registries and portals used by buyers, agents and registrars. The community’s listing in official datasets and property portals is accompanied by summaries of nearby amenity clusters such as parks, beaches, leisure venues and cinema complexes; these summaries are commonly supplied to help prospective buyers and renters assess local lifestyle options.
Local property records show multiple recent sale transactions for the subcommunity. For up-to-date listings, descriptions of completed developments and project stages, and active sales or leasing opportunities, consult specialist property portals and the Dubai Land Department transaction feeds that are published under government open-data initiatives.
The area benefits from the wider Al Barsha South context: proximity to shopping at Mall of the Emirates, access routes toward Dubai Marina and Palm Jumeirah, and direct road connections to central business districts and airports. Hospitality, dining and weekend-leisure offers in the vicinity are regularly aggregated by local guides that track restaurant promotions, ladies’ nights and brunch events.
Given its location inside the Al Barsha South zone and the measured distances to major Dubai destinations, Al Barsha South 2 is appropriate for residents who prioritise:
Property and transaction data for Al Barsha South 2 are included in open-data releases from Dubai authorities and in local property-portal summaries. Independent listings and community guides are used by buyers and renters to review recent transactions, neighbourhood maps and nearby amenities. Lifestyle and dining offers for the vicinity are frequently collated through partnerships between property guides and local hospitality publishers.
How close is the nearest Metro?
The nearest recorded Metro access is on the Red Line (station code R33) at a mapped distance of approximately 5,852 metres; this distance is not regarded as walkable for regular commuting.
How long does it take to drive to Dubai Mall and Palm Jumeirah?
Typical quoted driving times from the locality are roughly 19 minutes to Dubai Mall and about 13 minutes to Palm Jumeirah; actual times vary with traffic.
Are there schools near Al Barsha South 2?
Local property summaries reference schools close to the subcommunity, including Brighton College Dubai (around 0.6 km) and Dubai Heights Academy (around 0.7 km) as examples commonly noted in neighbourhood guides.
How many recorded sales are available for review?
Official transaction listings for the area include fifty sale records in the referenced property dataset; these records originate from the Dubai Land Department and are published as part of government open-data disclosures.
Machine-readable mirrors of this page: Markdown · JSON. Every field carries its origin.
How to cite:Al Barsha South 2 — Continental Club Property, 2026-08-12, https://continentalclub.ae/location/al-barsha-south-2/
The figures below come from registered Dubai Land Department transactions, not from listings. We show the median rather than the mean, so that one-off penthouses do not distort it.
The yearly figure compares the last 12 months with the 12 before them. Calendar years would not work here: the current one is unfinished, so the comparison would understate the change.
Top to bottom: purchase price per m², year, annual rent per m², gross yield. Showing the last 5 years, from 2019.
* 2026 is still in progress, so its bar covers part of the year and is not directly comparable with the ones before it. The growth figure below uses completed years only.
All figures are medians rather than means: in thin years the mean swings with the mix of units and shows movement the market never had. The yield is gross — service charges are not published in the register, so they cannot be deducted honestly.
| Building | Deals | Price per m² |
|---|---|---|
| Binghatti Hillviews | 1 589 | 18 583 |
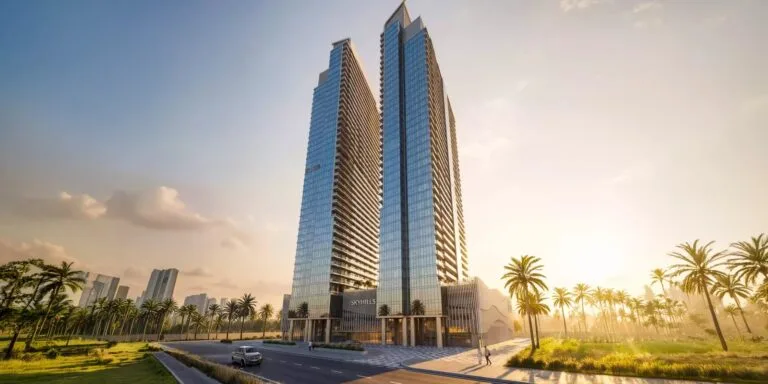
| Sky Hills Astra Tower A | 790 | 19 376 |
| Sky Hills Astra Tower B | 770 | 20 289 |
| Binghatti Hills - 2 | 527 | 19 720 |
| Vincitore Aqua Dimore | 507 | 17 537 |
| SAAS HILLS | 454 | 18 319 |
| Vincitore Aqua Flora | 393 | 19 215 |
| Binghatti Hillside | 346 | 20 478 |
| Binghatti Hills - 1 | 289 | 18 462 |
| 11 HILLS PARK | 174 | 16 615 |
| BELLA ROSE | 146 | 12 804 |
| Skyhills Residences - 1 | 143 | 15 890 |
Linked names lead to our pages for those projects.
Source: Dubai Land Department transaction registry. Prices per square metre, sale transactions.
Dubai market as a whole: prices, transactions and trends (DLD data) →
Largest management companies in the area: R D K Owners Associations Management (3), Deyaar Community Management (2), Aspire Lux Jointly Owned Property Management Services (1).
Check any building’s service charge → All communities
RERA-approved 2026 budgets from the DLD service charge index (Mollak); residential buildings. Rate is AED per sq ft per year; YoY compares the same buildings in 2025.



Neighbouring areas and sub-communities to compare location and prices.