
As of 23 October 2026, the 18 busiest Dubai Land Department registration districts accounted for 120,726 residential sales in 2025, or 65.9% of Dubai’s 183,060 recorded transactions. In 2025, apartment median prices ranged from AED 14,318 per m² in Me’Aisem First to AED 33,667 per m² in Palm Jumeirah; Dubai’s city median was AED 18,552 per m². The 2026 figures are incomplete and cannot be compared directly with full-year 2025 transaction or rental totals. District ranking below is an order by recorded transaction count, not a quality rating.
How Dubai district names work in DLD records
A Dubai area in an advert, a master project and a DLD registration district can have different names. This is one reason buyers see conflicting prices for what appears to be the same location. A DLD district is a registry unit identified by an area ID; it can contain several familiar communities and projects.
For example, Marsa Dubai (area ID 330) includes Dubai Marina, Dubai Harbour, Jumeirah Beach Residence (JBR), Bluewaters and TECOM Site D. Dubai Marina represented 56% of Marsa Dubai residential sales in 2025, while JBR represented 9%. So a Marsa Dubai median is not the same as a Dubai Marina-only median. Readers checking individual Marina transactions can use the Dubai Marina DLD transactions page.
- Al Barsha South Fourth (441) is Jumeirah Village Circle, commonly called JVC.
- Burj Khalifa (390) is the DLD district that includes Downtown Dubai and part of Business Bay. The master-project selection called DownTown Dubai can cross district boundaries.
- Business Bay (526) is a separate DLD district and master-project selection. Its figures should not be mixed automatically with Burj Khalifa district figures. See recorded transactions on the Business Bay page.
- Jabal Ali First (445) includes Al Furjan, Discovery Gardens, Wasl Gate and DMCC-EZ2.
- Al Thanyah Fifth (350) includes Jumeirah Lakes Towers, Jumeirah Islands and DMCC-EZ1.
- Al Khairan First (447) corresponds to Dubai Creek Harbour. Individual records are available on the Dubai Creek Harbour page.
- Hadaeq Sheikh Mohammed Bin Rashid (482) includes Dubai Hills Estate and District 7. For current recorded deals, see Dubai Hills Estate transactions.
This distinction matters before comparing a quoted price per square metre. A broker can help match a listing to its DLD district and transaction history, but the buyer should also verify the exact building, unit type, completion status and documents for the particular property.
PDF shortlist · updated 27 October 2026
New Dubai projects of October 2026
30 projects · prices from DLD and developers
-
 Rise By Athlon 1 Wadi Al Safa 5 · 1–3 BR
from AED 1,412,000
-
 Zuha Island Villas World Islands
from AED 68,000,000
-
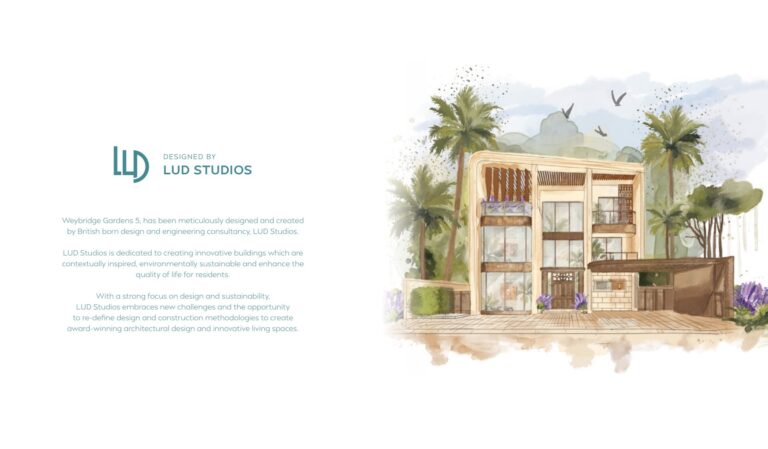 Weybridge Gardens Phase 5 by Leos Developments Dubailand Oasis
from AED 756,782
27 more in the PDF: prices, handover dates, payment plans
The PDF opens instantly. Refreshed monthly from DLD data.
The 18 busiest registration districts: 2025 residential sales
All figures below are medians, not averages. The price-per-metre column refers to apartments only. Sale medians combine off-plan and existing transactions, so they do not describe one building or one apartment condition. “Existing” includes both resale transactions and first sales of completed units from developers where the registry does not separate them.
| District | Sales 2025 | Median sale price, AED | Apartments, AED/m² | Off-plan | Existing |
|---|---|---|---|---|---|
| Al Barsha South Fourth (JVC) | 17,960 | 1,005,181 | 15,795 | 68.6% | 31.4% |
| Business Bay | 11,564 | 1,650,000 | 27,064 | 74.7% | 25.3% |
| Wadi Al Safa 5 | 11,089 | 1,017,000 | 14,698 | 83.1% | 16.9% |
| Madinat Al Mataar | 9,734 | 1,572,395 | 17,748 | 85.3% | 14.7% |
| Marsa Dubai | 6,997 | 2,500,000 | 28,909 | 47.4% | 52.6% |
| Jabal Ali First | 6,390 | 1,504,500 | 15,156 | 77.8% | 22.2% |
| Al Hebiah First | 5,854 | 1,178,992 | 20,613 | 81.0% | 19.0% |
| Dubai Investment Park Second | 5,732 | 1,243,000 | 15,773 | 96.7% | 3.3% |
| Wadi Al Safa 3 | 5,726 | 1,034,034 | 15,769 | 82.6% | 17.4% |
| Me’Aisem First | 5,677 | 765,000 | 14,318 | 74.5% | 25.5% |
| Madinat Dubai Almelaheyah | 5,462 | 2,494,850 | 32,113 | 98.6% | 1.4% |
| Al Barshaa South Second | 5,442 | 1,082,352 | 17,881 | 95.6% | 4.4% |
| Al Barsha South Fifth (JVT) | 5,147 | 1,054,182 | 16,785 | 85.1% | 14.9% |
| Hadaeq Sheikh Mohammed Bin Rashid | 4,619 | 2,270,000 | 26,141 | 65.9% | 34.1% |
| Al Thanyah Fifth | 4,117 | 2,030,000 | 23,310 | 58.0% | 42.0% |
| Burj Khalifa | 3,933 | 2,850,000 | 30,123 | 37.4% | 62.6% |
| Al Khairan First | 3,818 | 2,500,000 | 26,261 | 62.0% | 38.0% |
| Palm Jumeirah | 1,465 | 5,500,000 | 33,667 | 27.6% | 72.4% |
| Dubai total | 183,060 | 1,390,000 | 18,552 | 71.7% | 28.3% |
For a buyer comparing budget ranges rather than district labels, the median sale price is a starting point, not a budget requirement. The full transaction distribution can be much wider than the median. Current listings should be checked against recorded sales, and apartments in Dubai by district and price range can help narrow the initial search.
2026 activity to 23 October: incomplete year
From 1 January to 23 October 2026, Dubai recorded 114,050 residential transactions, against 183,060 in the full 2025 calendar year. The citywide median sale price was AED 1,314,000 and the apartment median was AED 18,428 per m². These figures do not establish a year-on-year decline or increase because 2026 covers less than a full year.
| District | Sales to 23.10.2026 | Median sale price, AED | Apartments, AED/m² | Off-plan |
|---|---|---|---|---|
| Madinat Al Mataar | 14,011 | 927,000 | 17,993 | 93.9% |
| Al Barsha South Fourth | 7,947 | 1,008,289 | 15,705 | 57.6% |
| Wadi Al Safa 5 | 6,225 | 968,050 | 15,538 | 85.6% |
| Wadi Al Safa 3 | 5,690 | 879,000 | 15,574 | 80.4% |
| Jabal Ali First | 4,947 | 1,519,760 | 16,302 | 69.6% |
| Business Bay | 3,761 | 2,065,000 | 25,873 | 52.9% |
| Al Khairan First | 3,079 | 2,650,000 | 27,553 | 70.3% |
| Me’Aisem First | 2,537 | 1,000,000 | 14,541 | 72.2% |
| Marsa Dubai | 2,481 | 2,666,000 | 24,675 | 20.6% |
| Al Hebiah First | 2,443 | 1,100,000 | 18,347 | 81.3% |
| Palm Jumeirah | 782 | 6,000,000 | 38,300 | 35.0% |
The remaining seven districts in the 2025 table also have incomplete 2026 records: Al Barsha South Fifth 2,279; Al Thanyah Fifth 2,023; Hadaeq Sheikh Mohammed Bin Rashid 1,836; Madinat Dubai Almelaheyah 1,790; Burj Khalifa 1,498; Dubai Investment Park Second 1,163; and Al Barshaa South Second 1,123 transactions.
Where apartment prices per m² were higher or lower than Dubai
Dubai’s 2025 apartment median was AED 18,552 per m². Among these 18 districts, Palm Jumeirah had the highest median at AED 33,667 per m², followed by Madinat Dubai Almelaheyah at AED 32,113 and Burj Khalifa at AED 30,123. Me’Aisem First had the lowest median at AED 14,318 per m², followed by Wadi Al Safa 5 at AED 14,698 and Jabal Ali First at AED 15,156.
Above the city median were 9 of the 18 districts: Palm Jumeirah, Madinat Dubai Almelaheyah, Burj Khalifa, Marsa Dubai, Business Bay (AED 27,064), Al Khairan First (AED 26,261), Hadaeq Sheikh Mohammed Bin Rashid (AED 26,141), Al Thanyah Fifth (AED 23,310) and Al Hebiah First (AED 20,613). Below the city median were the other 9: Al Barsha South Fourth, Wadi Al Safa 5, Madinat Al Mataar, Jabal Ali First, Dubai Investment Park Second, Wadi Al Safa 3, Me’Aisem First, Al Barshaa South Second and Al Barsha South Fifth. A lower district median does not mean every apartment there is cheaper: unit size, project, completion status and transaction mix can change the result.
For JVC specifically, the 2025 apartment median was AED 15,795 per m², below the city median. The JVC DLD data page separates that district comparison from a general description of the area.
Villa and townhouse price-per-metre figures should be treated separately. Registry area for villas can reflect plot area rather than built-up area, so it is not directly comparable with apartment AED/m² figures or across every villa transaction.
Apartment price movement from 2021 to 2025
The citywide apartment median moved from AED 12,220 per m² in 2021 to AED 18,552 per m² in 2025, a 51.8% change between two separate annual transaction samples. This is historical measurement, not a forecast and not a promise of future pricing.
| District | 2021 AED/m² | 2025 AED/m² | Change |
|---|---|---|---|
| Al Barsha South Fourth | 9,041 | 15,795 | +74.7% |
| Business Bay | 15,184 | 27,064 | +78.2% |
| Madinat Al Mataar | 7,088 | 17,748 | +150.4% |
| Marsa Dubai | 20,311 | 28,909 | +42.3% |
| Al Hebiah First | 7,224 | 20,613 | +185.3% |
| Me’Aisem First | 10,607 | 14,318 | +35.0% |
| Hadaeq Sheikh Mohammed Bin Rashid | 14,598 | 26,141 | +79.1% |
| Al Thanyah Fifth | 10,747 | 23,310 | +116.9% |
| Burj Khalifa | 18,778 | 30,123 | +60.4% |
| Palm Jumeirah | 18,056 | 33,667 | +86.5% |
Some percentage changes rely on small 2021 samples. Dubai Investment Park Second had 32 apartment transactions in 2021, Al Barshaa South Second had 90, and Al Barsha South Fifth had 134. Madinat Dubai Almelaheyah had only two apartment transactions in 2021, so no comparable percentage is shown. Changes in the buildings sold can also affect a median.
Rents and gross rental yields by district
Rental figures are 2025 annual medians for registered studio, one-bedroom and two-bedroom flat contracts. They include new contracts and renewals. Gross yield is the median annual rent divided by the median sale price for the same apartment type; the sale and rental samples are independent, so this is not the yield of a particular apartment.
| District | Studio rent | 1BR rent | 2BR rent | Gross yield: studio / 1BR / 2BR |
|---|---|---|---|---|
| Al Barsha South Fourth | 48,000 | 70,000 | 92,000 | 6.9% / 6.4% / 5.6% |
| Business Bay | 70,000 | 88,000 | 125,000 | 6.0% / 4.4% / 4.1% |
| Marsa Dubai | 66,000 | 95,000 | 140,000 | 4.7% / 4.5% / 4.1% |
| Jabal Ali First | 42,000 | 60,000 | 79,000 | 6.7% / 5.0% / 4.6% |
| Al Hebiah First | 44,100 | 66,000 | 106,538 | 6.5% / 5.7% / 5.4% |
| Me’Aisem First | 36,000 | 55,000 | 76,875 | 6.0% / 5.5% / 5.3% |
| Madinat Dubai Almelaheyah | — | 60,500 | 78,750 | — / 2.6% / 2.1% |
| Hadaeq Sheikh Mohammed Bin Rashid | 55,000 | 90,000 | 145,000 | 6.6% / 5.3% / 5.1% |
| Burj Khalifa | 75,000 | 120,000 | 180,000 | 4.3% / 5.6% / 4.9% |
| Palm Jumeirah | 92,500 | 147,000 | 210,000 | 6.2% / 4.0% / 4.2% |
The table shows ten of the 18 districts. Yield is shown only where there are at least 50 sales and 50 rental contracts for the apartment type; Madinat Dubai Almelaheyah has only 11 studio rental contracts, so no studio yield is calculated.
The highest shown gross yield among the 18 district rows was 6.9% for studios in Al Barsha South Fourth. Gross figures are before service charges, management, maintenance, vacancy, leasing costs and the 4% DLD purchase fee. Service charges can materially change an individual property calculation; use the explanation of service charges and property returns before treating a gross percentage as income.
A net yield requires the actual unit’s purchase cost, annual service charge, rental arrangement and expected operating costs. The broker can organise transaction comparisons. For methodology beyond a gross ratio, see how net rental yield is calculated.
What was bought: apartment size mix and communities inside districts
One-bedroom apartments formed 44.5% of Dubai apartment transactions with stated bedroom counts in 2025. In Al Hebiah First, one-bedrooms represented 72.8%; in Dubai Investment Park Second, 80.3%. Studios were the largest category in Me’Aisem First at 56.1%, while two-bedroom and larger units formed larger shares in Palm Jumeirah: 38.5% two-bedroom and 31.0% with three or more bedrooms.
These records show transactions, not buyer profiles. District median sale prices (all unit types, off-plan and existing mixed) were AED 765,000 in Me’Aisem First, AED 1,005,181 in Al Barsha South Fourth, AED 2,500,000 in Marsa Dubai and AED 5,500,000 in Palm Jumeirah. Because the share of villas differs between districts, compare districts by the apartment AED/m² column.
Community figures that should not be added to the 18-district total
Dubai Marina is inside Marsa Dubai: 3,909 sales in 2025, AED 24,014 per m² for apartments only (the Dubai Marina article gives AED 23,998 per m² for apartments, villas and townhouses), and median annual rents of AED 65,000 for a studio, AED 90,000 for a one-bedroom and AED 140,000 for a two-bedroom. Its gross yield figures were 4.7%, 4.7% and 5.4% respectively.
Downtown Dubai, counted as the DownTown Dubai master-project selection across districts, recorded 3,493 sales, AED 31,391 per m² and median annual rents of AED 75,000, AED 120,000 and AED 185,000 for studio, one-bedroom and two-bedroom apartments. The Downtown Dubai page is useful when checking transactions that should not be confused with the entire Burj Khalifa registry district.
Al Furjan, inside Jabal Ali First, recorded 2,791 sales and AED 14,387 per m² in 2025. Arjan, in Al Barshaa South Third rather than Al Barsha South Fourth, recorded 3,746 sales and AED 15,298 per m². Town Square recorded 2,746 sales and AED 15,616 per m²; Sobha Hartland recorded 1,318 and AED 22,207 per m²; Damac Hills 2 recorded 292 and AED 12,735 per m². These are separate reference selections and overlap with, or sit outside, the 18-district list.
District notes, in 2025 transaction-count order
Al Barsha South Fourth (JVC) recorded 17,960 sales, a AED 1,005,181 median sale price and AED 15,795 per m² for apartments. Studios and one-bedrooms formed 33.3% and 52.7% of apartment transactions with stated bedroom counts.
Business Bay recorded 11,564 sales, a AED 1,650,000 median and AED 27,064 per m². Its apartment mix was 38.0% studios, 38.3% one-bedrooms and 18.6% two-bedrooms.
Wadi Al Safa 5 had 11,089 sales, a AED 1,017,000 median and AED 14,698 per m². Its recorded apartment mix had 44.1% studios and 35.9% one-bedrooms.
Madinat Al Mataar recorded 9,734 sales, a AED 1,572,395 median and AED 17,748 per m². One-bedroom and two-bedroom apartments represented 38.1% and 33.3% of stated-bedroom apartment sales.
Marsa Dubai recorded 6,997 sales, a AED 2,500,000 median and AED 28,909 per m². The district includes Marina and JBR, so these figures are not Marina-only figures; 30.7% of apartment sales were two-bedrooms and 19.1% were 3+ bedroom units.
Jabal Ali First recorded 6,390 sales, a AED 1,504,500 median and AED 15,156 per m². Al Furjan is part of this registry district, and one-bedroom and two-bedroom apartments made up 41.4% and 39.4% of the stated-bedroom mix.
Al Hebiah First (DLD area 444), which corresponds to Motor City, recorded 5,854 sales and AED 20,613 per m². One-bedroom apartments accounted for 72.8% of transactions with stated bedroom counts.
Dubai Investment Park Second recorded 5,732 sales, a AED 1,243,000 median and AED 15,773 per m². Its 2025 off-plan share was 96.7%, while one-bedrooms represented 80.3% of its apartment mix.
Wadi Al Safa 3 recorded 5,726 sales, a AED 1,034,034 median and AED 15,769 per m². Studios made up 41.0% of stated-bedroom apartment sales.
Me’Aisem First recorded 5,677 sales, the lowest apartment median per m² in this table at AED 14,318, and a AED 765,000 transaction median. Studios accounted for 56.1% of its apartment mix.
Madinat Dubai Almelaheyah recorded 5,462 sales, AED 2,494,850 as the median sale price and AED 32,113 per m². Its off-plan share was 98.6%; one-bedrooms represented 53.4% of apartment sales with stated bedroom counts.
Al Barshaa South Second recorded 5,442 sales, a AED 1,082,352 median and AED 17,881 per m². Studios and one-bedrooms formed 48.4% and 40.0% of apartment transactions.
Al Barsha South Fifth, commonly associated with JVT, recorded 5,147 sales, a AED 1,054,182 median and AED 16,785 per m². One-bedrooms represented 49.3% of stated-bedroom apartment sales.
Hadaeq Sheikh Mohammed Bin Rashid recorded 4,619 sales, a AED 2,270,000 median and AED 26,141 per m². Dubai Hills Estate made up 83% of transactions in the master-project composition shown for this registry district.
Al Thanyah Fifth recorded 4,117 sales, a AED 2,030,000 median and AED 23,310 per m². It includes Jumeirah Lakes Towers and Jumeirah Islands; one-bedrooms made up 43.2% of the apartment mix.
Burj Khalifa district recorded 3,933 sales, a AED 2,850,000 median and AED 30,123 per m². Existing transactions represented 62.6% of sales, and the district must not be treated as identical to the Downtown master-project selection.
Al Khairan First (DLD area 447), which corresponds to Dubai Creek Harbour, recorded 3,818 sales, a AED 2,500,000 median and AED 26,261 per m². One-bedroom and two-bedroom apartments represented 42.6% and 41.2% of its stated-bedroom mix.
Palm Jumeirah recorded 1,465 sales, a AED 5,500,000 median and the highest apartment median per m² in this table at AED 33,667. Existing transactions formed 72.4%; two-bedroom and 3+ bedroom apartments accounted for 38.5% and 31.0% of the stated-bedroom mix.
How to use these figures when choosing an area
Start by deciding whether the comparison is between districts, communities or specific buildings. Then compare apartment type with the same apartment type, and off-plan with the relevant payment and completion documents rather than with an existing unit as if they were identical products. What the registry does not show: peak-hour traffic, parking, noise, nearby construction timelines and the condition of a specific building are not in DLD data. Those are checked on site and in the building’s documents; the registry only shows prices, deals and rents.
For an existing property, compare its asking price with recent transactions in the same district and, where available, the same project. For an off-plan purchase, ask for the project documents and payment schedule, A broker can explain the process, prepare property comparisons and assist with documents. A broker does not receive client money: payments go to the developer’s escrow account or through a DLD trustee office.
Once a district and unit type are defined, readers can review Dubai area pages with prices and recorded sales, then move to the ready apartment catalogue for individual properties. For a structured comparison of purpose, holding period, budget and property type without treating any district as a universal answer, use how to choose an area in Dubai.
See also: Dubai Marina in DLD numbers · Dubai Hills Estate in DLD numbers · Dubai Creek Harbour in DLD numbers · Jumeirah in DLD numbers · Al Barsha in DLD numbers · villas and townhouses by area · studios by area.
See also: Dubai’s future metro: Blue Line, Gold Line and DLD sales in areas on the route.
Frequently asked questions
Which district had the most transactions?
Al Barsha South Fourth, the DLD district corresponding to JVC, had 17,960 residential sales in 2025.
Where was the highest apartment price per m²?
Palm Jumeirah had the highest median apartment price in the 18-district table: AED 33,667 per m² in 2025.
Where was the lowest apartment price per m²?
Me’Aisem First had the lowest median apartment price in the table: AED 14,318 per m² in 2025, compared with AED 18,552 per m² across Dubai.
Which district had the largest off-plan share?
Madinat Dubai Almelaheyah had the largest 2025 off-plan share among the 18 rows at 98.6%. Dubai Investment Park Second followed at 96.7%.
Where was gross rental yield highest?
The highest figure shown was 6.9% for studios in Al Barsha South Fourth. It is a gross market ratio before service charges, vacancy, management, maintenance and other ownership costs.
What is a DLD registration district?
It is the registry area used to record a property transaction. It may include several familiar communities, so it does not always match the name used in advertisements or everyday conversation.
Is JBR part of Dubai Marina?
JBR and Dubai Marina are both inside the Marsa Dubai DLD district, but they are separate master-project selections in the transaction records. Marsa Dubai figures therefore combine them with Dubai Harbour, Bluewaters and other included locations.
Why can’t 2026 be compared directly with 2025?
The 2026 data runs to 23 October 2026, while 2025 covers all twelve months. Sales and rental contract totals for the incomplete period are not like-for-like annual figures.
Discuss a purchase in Dubai
If you are considering a purchase, arrange a free consultation to go through the property, the transaction steps and the documents.
PDF shortlist · updated 27 October 2026
New Dubai projects of October 2026
30 projects · prices from DLD and developers
30 more in the PDF: prices, handover dates, payment plans
The PDF opens instantly. Refreshed monthly from DLD data.
Read next
- EOI and pre-launch booking in Dubai: how buyers secure the best units before an official launch
- Buying at launch in Dubai: what happened to prices in 74 off-plan projects from 2021–2024, by DLD data
- Developer offers in Dubai: types of deals, how buyers get them through an agency and what to check in the SPA