
As of October 2026, a recorded Dubai house purchase classified as Villa had a median price of AED 3,406,888 in 2026 to 26 October, versus AED 3,613,888 in 2025. There were 16,769 Villa transactions in 2025 and 11,427 in the incomplete 2026 (to 26 October); a full and an incomplete year are not compared directly. The 2026 median transaction price is lower than in 2025, while the median price per square metre is higher at AED 18,305. The register does not separate townhouses from villas, so all figures below cover both within the single Villa category.
What the Dubai register calls a Villa: villas and townhouses in one category
For a buyer searching “buy a house in Dubai”, the first limitation is terminology. Transactions are recorded under the property type Villa. Between 2021 and 26 October 2026, this includes 88,083 residential sales. The subtype is recorded as Villa in 70,784 transactions and is blank in another 17,299. There is no Townhouse subtype in this transaction category.
This means a detached house and a townhouse cannot be separated reliably from the recorded Villa data. A townhouse may be included in the Villa total, but the data does not permit a confirmed split. There are 132 separate transactions recorded as Unit with subtype Stacked Townhouses from 2021 to 26 October 2026; they are not included in the Villa tables.
Bedroom data also has a gap. Bedrooms are specified in 70,754 of 88,083 Villa transactions, or 80.3%. A table by bedroom count therefore describes only the transactions where that field was completed. It should not be used as a count of every house sold.
District names below follow the register rather than marketing geography. For example, Al Yelayiss 1 and Wadi Al Safa 5 are district names; the master-project name alongside them is the project with the largest share of recorded transactions in that district, not a rebranding of the district.
PDF shortlist · updated 27 October 2026
New Dubai projects of October 2026
30 projects · prices from DLD and developers
-
 Rise By Athlon 1 Wadi Al Safa 5 · 1–3 BR
from AED 1,412,000
-
 Zuha Island Villas World Islands
from AED 68,000,000
-
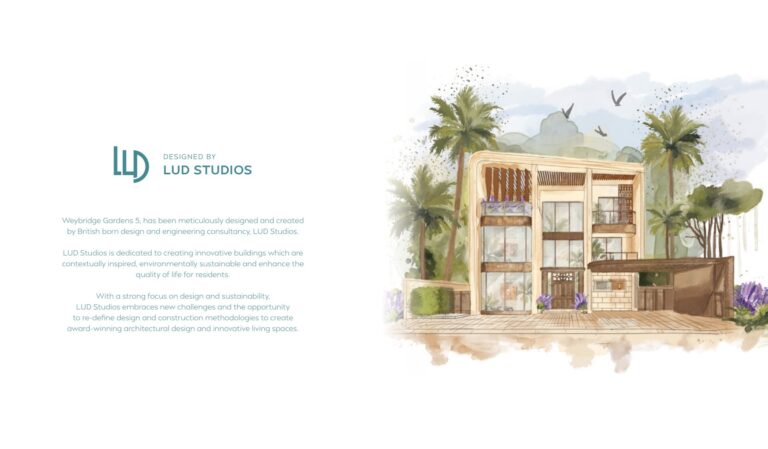 Weybridge Gardens Phase 5 by Leos Developments Dubailand Oasis
from AED 756,782
27 more in the PDF: prices, handover dates, payment plans
The PDF opens instantly. Refreshed monthly from DLD data.
Villa and townhouse sales, 2021–2026
The table uses medians, not averages. Sales are residential transactions classified as Villa, with filtered transaction values, areas and prices per square metre. Off-plan means an Off-Plan Properties registration; ready property includes Existing Properties, including first sales of completed homes by a developer.
| Year | Transactions | Median price, AED | Median AED/m² | Median area, m² | Off-plan share |
|---|---|---|---|---|---|
| 2021 | 11,568 | 2,075,000 | 8,733 | 239.2 | 46.2% |
| 2022 | 12,723 | 2,130,000 | 9,128 | 244.8 | 49.1% |
| 2023 | 15,757 | 2,850,000 | 11,373 | 238.3 | 52.7% |
| 2024 | 19,839 | 3,184,888 | 14,318 | 230.0 | 60.7% |
| 2025 | 16,769 | 3,613,888 | 15,848 | 232.2 | 55.4% |
| 2026 to 26 October | 11,427 | 3,406,888 | 18,305 | 180.5 | 65.5% |
From 2021 to 2025, the median Villa transaction price moved from AED 2,075,000 to AED 3,613,888, while the median price per square metre moved from AED 8,733 to AED 15,848. In the incomplete 2026 period, the median ticket is AED 207,000 lower than in 2025, the median area is smaller by 51.7 m², and the off-plan share is higher by 10.1 percentage points. These are recorded medians rather than a valuation of an individual house.
The 2026 transaction count cannot be treated as a full-year comparison because data stops on 26 October. The recorded counts are 11,427 Villa transactions to that date and 16,769 in the whole of 2025. Recent weeks can also be added to the register later.
Transactions by bedrooms: 2025 and 2026
| Year | Bedrooms | Transactions | Median price, AED | Median AED/m² | Median area, m² | Off-plan share |
|---|---|---|---|---|---|---|
| 2025 | 3 | 6,366 | 3,130,444 | 17,560 | 174.0 | 61.9% |
| 2025 | 4 | 5,429 | 4,100,000 | 14,660 | 276.0 | 73.5% |
| 2025 | 5 | 665 | 5,150,000 | 15,596 | 364.0 | 79.4% |
| 2025 | 6 and more | 60 | 24,873,000 | 28,728 | 974.0 | 90.0% |
| 2026 to 26 October | 3 | 2,774 | 3,118,500 | 18,053 | 172.5 | 48.8% |
| 2026 to 26 October | 4 | 5,074 | 2,910,000 | 19,324 | 144.1 | 79.9% |
| 2026 to 26 October | 5 | 1,698 | 4,525,770 | 19,553 | 233.4 | 96.3% |
| 2026 to 26 October | 6 and more | 47 | 21,000,000 | 33,086 | 760.2 | 80.9% |
Note: “6 and more” bedrooms in sales means 6 and 7 bedrooms; in the rental table below it includes contracts of up to 10 bedrooms.
In 2025, 2,837 Villa sales did not state bedroom count and 1,412 were recorded with one or two bedrooms. In 2026 to 26 October, 1,113 lacked bedroom data and 721 had one or two bedrooms. The four-bedroom median changed from AED 4,100,000 in 2025 to AED 2,910,000 in the incomplete 2026 period; its recorded median area also changed from 276.0 m² to 144.1 m². That composition difference is one reason not to treat a category median as the price of every four-bedroom home.
Where more house transactions were recorded
This is an ordering by transaction count, not a rating of districts, projects, construction quality or suitability. For 2025 through 26 October 2026, the 15 districts below account for 23,257 transactions, or 82.5% of all recorded Villa sales in that period.
| No. | District | Transactions | Median price, AED | Median AED/m² | Area, m² | Off-plan | Main master-project |
|---|---|---|---|---|---|---|---|
| 1 | Al Yelayiss 1 | 4,146 | 2,904,000 | 19,610 | 144.0 | 87.2% | Al Aryam (1%) |
| 2 | Wadi Al Safa 5 | 3,109 | 3,222,030 | 15,926 | 196.0 | 62.7% | Arabian Ranches 3 (14%) |
| 3 | Al Yufrah 1 | 2,997 | 3,400,000 | 15,039 | 257.5 | 84.3% | The Valley (17%) |
| 4 | Madinat Al Mataar | 2,699 | 3,946,888 | 14,718 | 279.4 | 74.0% | Dubai World Central (82%) |
| 5 | Wadi Al Safa 7 | 1,862 | 1,467,609 | 14,289 | 88.3 | 57.2% | Rukan (26%) |
| 6 | Dubai Investment Park Second | 1,725 | 3,644,888 | 19,669 | 148.7 | 100.0% | — |
| 7 | Wadi Al Safa 3 | 1,093 | 4,750,000 | 23,909 | 231.6 | 61.0% | Mohammed Bin Rashid AL Maktoum District 11 (57%) |
| 8 | Dubai Investment Park First | 933 | 1,444,150 | 12,822 | 104.0 | 85.7% | Dubai Investment Park First (100%) |
| 9 | Al Hebiah Sixth | 911 | 3,510,000 | 16,562 | 189.0 | 35.2% | Mudon (100%) |
| 10 | Al Thanayah Fourth | 905 | 4,850,000 | 17,437 | 263.9 | 0.0% | Emirates Living (27%) |
| 11 | Nad Al Shiba First | 609 | 5,643,000 | 26,144 | 195.8 | 85.9% | Nad Al Sheba Gardens (16%) |
| 12 | Al Yelayiss 2 | 607 | 2,800,000 | 14,102 | 188.2 | 7.1% | TOWN SQUARE (100%) |
| 13 | Hadaeq Sheikh Mohammed Bin Rashid | 563 | 6,400,000 | 23,918 | 274.7 | 16.2% | HADAEQ SHEIKH MOHAMMED BIN RASHID – DISRICT 7 (33%) |
| 14 | Wadi Al Safa 6 | 557 | 6,450,000 | 14,844 | 525.5 | 0.0% | Arabian Ranches – 1 (66%) |
| 15 | Al Barsha South Fourth | 541 | 3,030,000 | 16,848 | 174.8 | 7.0% | Jumeirah Village Circle (100%) |
Al Yelayiss 1 has the largest recorded count, 4,146 sales, and an 87.2% off-plan share. Wadi Al Safa 5 follows with 3,109 sales and a 62.7% off-plan share. Al Thanayah Fourth and Wadi Al Safa 6 show no off-plan transactions in this period under the registration definition used here.
Among individual project names, the largest transaction counts were Reportage Village 1 with 892 sales, The Valley – Vindera with 577, Grand Polo – Equiterra with 511, DAMAC ISLANDS 2 – BAHAMAS 2 with 503, and Rukan 3 with 480. This only identifies where more recorded transactions occurred. There are also 2,943 Villa transactions during the period without a project name.
For a wider district comparison, use the area pages with prices and recorded transactions. The relevant comparison is usually the price, area, registration type and completed status of a specific home, not the position of a district in a transaction-count table.
Villa rents and gross yields: what the numbers can and cannot show
Rental figures are annual medians from Ejari Villa contracts. They include new contracts and renewals. Contracts recorded as Complex Villas are excluded, although sales data does not provide the same separation. In 2026 to 26 October, median annual rent was AED 150,000 for three bedrooms, AED 210,000 for four bedrooms, AED 300,000 for five bedrooms and AED 280,000 for six or more bedrooms.
| Bedrooms | 2025 contracts | 2025 median rent, AED/year | 2026 contracts to 26 Oct | 2026 median rent, AED/year |
|---|---|---|---|---|
| 2 | 3,630 | 130,000 | 2,907 | 135,000 |
| 3 | 23,500 | 150,000 | 19,874 | 150,000 |
| 4 | 15,198 | 212,520 | 13,661 | 210,000 |
| 5 | 5,462 | 300,000 | 4,794 | 300,000 |
| 6 and more | 1,744 | 288,125 | 1,418 | 280,000 |
Several districts show lower median rents in 2026 than in 2025: Wadi Al Safa 5 moved from AED 170,000 to AED 165,000, Al Yufrah 1 from AED 140,000 to AED 138,000, Wadi Al Safa 3 from AED 200,000 to AED 190,000, and Hadaeq Sheikh Mohammed Bin Rashid from AED 285,000 to AED 280,000. Other district medians were unchanged or higher. The 2026 period is incomplete and does not establish a full-year figure.
For 2025, the citywide calculated gross Villa yield was 4.8% when median annual rent of AED 173,250 was divided by median purchase price of AED 3,613,888. The check based on median AED/m² was 4.3%. This is gross yield before service charges, brokerage fees, vacancy between tenants and the DLD registration fee. It is not a promised return and it is not the net yield of a particular property.
| District | 2025 gross yield by medians | Check by AED/m² |
|---|---|---|
| Al Yelayiss 1 | 5.3% | 5.0% |
| Wadi Al Safa 5 | 5.3% | 5.7% |
| Al Yufrah 1 | 4.1% | 5.2% |
| Madinat Al Mataar | 3.2% | 4.7% |
| Wadi Al Safa 7 | 10.4% | 5.4% |
| Dubai Investment Park Second | — | — |
| Wadi Al Safa 3 | 4.1% | 3.7% |
| Dubai Investment Park First | 5.8% | 4.4% |
| Al Hebiah Sixth | 5.6% | 5.0% |
| Al Thanayah Fourth | 4.0% | 4.1% |
| Nad Al Shiba First | 6.0% | 4.2% |
| Al Yelayiss 2 | 5.4% | 5.3% |
| Hadaeq Sheikh Mohammed Bin Rashid | 4.1% | 4.9% |
| Wadi Al Safa 6 | 4.1% | 4.2% |
| Al Barsha South Fourth | 5.8% | 5.3% |
All 15 districts from the table above are shown; the order is by number of transactions. Dubai Investment Park Second has no rental contracts in the dataset, so no yield is calculated for it. The yield by medians covers a different number of deals in each district.
These percentages compare two independent samples: completed sale transactions and rental contracts. Wadi Al Safa 7 shows why the distinction matters. Its yield by price medians is 10.4%, while the AED/m² calculation is 5.4%. The median sold Villa area was 88.1 m² and the median rented Villa area was 187.0 m², so the samples represent different house sizes. Where this happens, the AED/m² check reflects the same object size more accurately.
Community charges and operating costs are not deducted from gross yield. Our guide to service charges and their effect on property returns explains why gross rent is not money retained by the owner. For a cost-based calculation, see how net yield is calculated.
Off-plan, ready houses and apartments: a buyer’s comparison
Off-plan is a registration before completion. A ready or existing property is recorded as Existing Properties, which can include a completed home sold by a developer for the first time. In 2026 to 26 October, 65.5% of Villa transactions were off-plan. In 2025, the share was 55.4%.
Oqood is the registration of an off-plan sale contract. A broker can explain the process and help review transaction data, but does not provide legal or tax conclusions.
The title deed is the ownership document for completed registered property. Questions of personal ownership, inheritance, tax residence and contracts require advice from a qualified lawyer or tax adviser.
For 2025, the median Villa price was AED 3,613,888 against AED 1,295,007 for apartments recorded as Unit. The Villa median was 2.8 times the apartment median. Yet median Villa AED/m² was AED 15,848, below the apartment figure of AED 18,552 per m². Villa transactions represented 9.2% of residential transactions, with 16,769 Villa sales and 166,291 apartment sales.
Completed apartment stock is listed in the ready apartments catalogue, and Villa-classified homes in the villas and townhouses catalogue.
How buying a house in Dubai is organised
A district median is a screening number; it does not replace the documents for the selected unit, plot and contract.
For a completed home, the documents include the title deed, the community’s service-charge position and the transfer documents for that transaction. For off-plan, the registration process includes the document commonly called oqood. A bank explains its own lending requirements and documents if financing is considered.
The broker can help shortlist homes using recorded sales, prepare transaction documents and accompany the purchase process. The broker does not accept client funds, exchange or transfer money, open bank accounts, provide loans, or issue tax and legal opinions. Payments on off-plan properties go through the developer’s escrow account; deals on ready homes are formalised through a registration trustee’s office. A lawyer, tax adviser or bank should be consulted where their specialist advice is required.
The detailed sequence is set out in our step-by-step guide to buying a villa in Dubai.
Budgets seen in registered deals
The recorded structure shows where transactions cluster by price, not where a buyer “should” live. Median prices by district are in the table above; they cover the entire recorded Villa category and do not show the price of a detached villa or a townhouse separately.
Three-bedroom transactions had a median of AED 3,118,500 in 2026 to 26 October. Four-bedroom transactions had a median of AED 2,910,000, but their median recorded area was 144.1 m², substantially below the 2025 four-bedroom median area. Total price and AED/m² are both shown because the plot, built-up area and configuration differ between homes.
What the registry does not show
The registry records prices, areas and dates. It does not show finishing quality, infrastructure, views, noise or the surroundings; these are checked on site and against the documents.
A comparison of areas by budget and intended use is in how to choose an area in Dubai for your goal.
See also: Jumeirah villas in DLD numbers · studios by DLD data · Dubai Hills Estate in DLD numbers.
Frequently asked questions
How much does a house in Dubai cost in real transactions?
The median recorded Villa transaction was AED 3,406,888 in 2026 to 26 October. In 2025, it was AED 3,613,888. These medians include both villas and townhouses because the register does not split them.
Does the register distinguish a townhouse from a villa?
No. Sales recorded as Villa have subtype Villa or a blank subtype; there is no Townhouse subtype in this category. Figures for “houses” therefore cover both together.
Which areas had the most house transactions?
For 2025 to 26 October 2026, Al Yelayiss 1 had 4,146 Villa transactions, Wadi Al Safa 5 had 3,109, Al Yufrah 1 had 2,997, and Madinat Al Mataar had 2,699. This is a transaction-count order, not a quality ranking.
What is the price of a three-bedroom Villa?
The 2026 median for recorded three-bedroom Villa sales was AED 3,118,500, with a median area of 172.5 m². The figure excludes transactions where bedroom count was missing.
How much is Villa rent for three or four bedrooms?
In 2026 to 26 October, median annual rent was AED 150,000 for three bedrooms and AED 210,000 for four bedrooms. In 2025, the figures were AED 150,000 and AED 212,520.
What gross yield do villas produce compared with apartments?
The calculated 2025 citywide gross yield for Villas was 4.8% by median rent divided by median sale price, or 4.3% using AED/m². This page does not calculate an equivalent apartment yield. Gross yield is before service charges, vacancy, commissions and the DLD registration fee.
What share of villa transactions are off-plan?
Off-plan represented 65.5% of recorded Villa transactions in 2026 to 26 October, compared with 55.4% in 2025. A ready-property transaction is recorded as Existing Properties; this can include a first sale of a completed property by a developer.
Why does Wadi Al Safa 7 show 10.4% yield but 5.4% by square metre?
The sale and rental samples have different median areas: 88.1 m² for sold Villas and 187.0 m² for rented Villas. The 10.4% result compares two different-size medians; the 5.4% AED/m² check reflects the same object size more accurately.
Discuss a purchase in Dubai
If you are considering a purchase, arrange a free consultation to go through the property, the transaction steps and the documents.
PDF shortlist · updated 27 October 2026
New Dubai projects of October 2026
30 projects · prices from DLD and developers
30 more in the PDF: prices, handover dates, payment plans
The PDF opens instantly. Refreshed monthly from DLD data.