
As at 23 October 2026, Dubai Creek Harbour recorded 3,079 residential apartment sales in 2026, with a median transaction price of AED 2,650,000 and a median of AED 27,553 per m². The year is incomplete, so its sales count should not be compared mechanically with full-year totals. Rental medians were lower than in 2025 for the main apartment types: AED 95,000 for a one-bedroom, AED 145,000 for a two-bedroom and AED 210,000 for a three-bedroom. Off-plan transactions accounted for 70.3% of 2026 sales, so a large part of the price statistics relates to homes still under construction rather than rented, completed apartments.
Where Dubai Creek Harbour sits in the DLD register
Dubai Creek Harbour is recorded as a master project within Al Khairan First, area_id 447. For this page, the area means the master project named “Dubai Creek Harbour” only: 31,215 transaction records of all types and 23,988 rental contract records are linked to it in the register (the master-project total before filtering by type and area).
The figures exclude 16 records for the master project “The Lagoons” within the same area_id, as well as 77 Ras Al Khor records without a master-project or project-name connection to Dubai Creek Harbour. The master project is entirely within one recorded area. You can see current registered activity on the Dubai Creek Harbour area page with live transactions.
Sales in the tables below include registered residential Units and Villas only, subject to transaction-price, area and AED-per-m² filters designed to exclude obvious input errors. In practice, every qualifying sale in this master project is an apartment transaction: there were no registered Villa transactions in 2021 through 23 October 2026.
This matters for a buyer searching for a villa or townhouse. Dubai Creek Harbour does not provide a separate recorded villa or townhouse market in these figures. A search here is therefore a search for apartments, with differences in bedroom count, building name, completion status and transaction type.
PDF shortlist · updated 27 October 2026
New Dubai projects of October 2026
30 projects · prices from DLD and developers
-
 Rise By Athlon 1 Wadi Al Safa 5 · 1–3 BR
from AED 1,412,000
-
 Zuha Island Villas World Islands
from AED 68,000,000
-
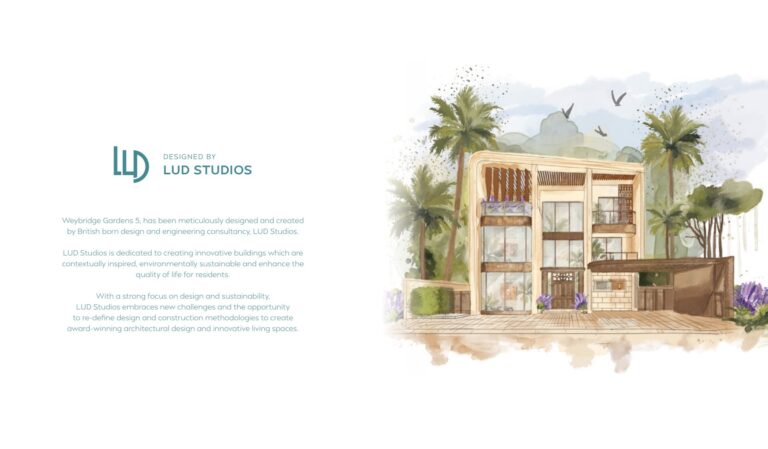 Weybridge Gardens Phase 5 by Leos Developments Dubailand Oasis
from AED 756,782
27 more in the PDF: prices, handover dates, payment plans
The PDF opens instantly. Refreshed monthly from DLD data.
Apartment sales by year: 2021 to 2026
All price figures in this section are medians, not averages. A median is the middle registered result after transactions are ordered by value: half of qualifying transactions are above it and half below it. It does not describe the asking price of every listing or the price of a particular floor, view, payment plan or completed unit.
| Year | Sales | Median sale price, AED | Median price, AED/m² | Off-plan share | Existing share |
|---|---|---|---|---|---|
| 2021 | 923 | 2,415,888 | 18,202 | 54.1% | 45.9% |
| 2022 | 3,487 | 1,849,888 | 19,207 | 76.3% | 23.7% |
| 2023 | 4,536 | 2,150,000 | 22,194 | 70.2% | 29.8% |
| 2024 | 4,051 | 2,443,888 | 25,637 | 72.6% | 27.4% |
| 2025 | 3,818 | 2,500,000 | 26,261 | 62.0% | 38.0% |
| 2026 to 23 October | 3,079 | 2,650,000 | 27,553 | 70.3% | 29.7% |
There were 19,894 registered sales from 2021 to 23 October 2026. The count increased from 923 in 2021 to 3,818 in 2025, while the median price per m² moved from AED 18,202 to AED 26,261 over the same full-year comparison.
For 2026, the count of 3,079 covers 1 January to 23 October 2026 only. It is not evidence that the full-year number will be above or below 2025. A rolling 12-month period from 24 October 2025 to 23 October 2026 recorded 3,926 sales, a median transaction price of AED 2,650,000 and AED 27,540 per m². The available figures do not provide a matching earlier rolling-12-month median for a like-for-like statement about whether the median sale price fell.
For a buyer worried that advertising prices may differ from signed deals, the practical starting point is the registered median for the relevant bedroom type, followed by the latest transactions in the same building and the same registration category. A resale listing should be tested against the Dubai Creek Harbour apartment resale report, rather than against a developer launch price or a general area average.
What buyers bought: apartment sizes, prices and AED per m²
The 2025 and 2026 records show that one-bedroom and two-bedroom apartments made up most of the recorded activity. The table covers apartments with a stated bedroom count. Four-bedroom apartments are not shown because the sales threshold of 30 transactions per year was not met.
| Year | Type | Sales | Median price, AED | Median area, m² | Median price, AED/m² |
|---|---|---|---|---|---|
| 2025 | 1 bedroom | 1,626 | 1,910,399 | 70.4 | 27,220 |
| 2025 | 2 bedrooms | 1,573 | 2,967,888 | 109.6 | 25,519 |
| 2025 | 3 bedrooms | 589 | 4,124,888 | 167.2 | 24,857 |
| 2026 to 23 October | 1 bedroom | 1,299 | 1,937,888 | 70.0 | 27,843 |
| 2026 to 23 October | 2 bedrooms | 1,339 | 3,232,888 | 115.3 | 26,810 |
| 2026 to 23 October | 3 bedrooms | 421 | 4,400,000 | 170.5 | 26,391 |
A one-bedroom apartment had a 2026 median recorded sale price of AED 1,937,888 for 70.0 m². A two-bedroom median was AED 3,232,888 for 115.3 m², while the three-bedroom median was AED 4,400,000 for 170.5 m².
The sales breakdown by bedroom count has no studio row, so no studio sale median is shown.
For buyers comparing a fixed budget across districts, the relevant question is not only the total purchase price. It is also how much registered area that budget has bought in a specified period and whether the transaction was off-plan or Existing. The Dubai apartment prices by area page can be used for a wider budget comparison.
Price per m² compared with Dubai
| Year | Dubai median, AED/m² | Dubai Creek Harbour median, AED/m² | Difference |
|---|---|---|---|
| 2021 | 11,055 | 18,202 | +64.7% |
| 2022 | 13,902 | 19,207 | +38.2% |
| 2023 | 15,247 | 22,194 | +45.6% |
| 2024 | 16,753 | 25,637 | +53.0% |
| 2025 | 18,159 | 26,261 | +44.6% |
| 2026 to 23 October | 18,418 | 27,553 | +49.6% |
In the trailing 12 months to 23 October 2026, the Dubai Creek Harbour median was AED 27,540 per m² versus AED 18,548 per m² for Dubai under the same property filters, a difference of 48.5%. This comparison is a price-per-m² observation, not a ranking of districts or a statement about future pricing.
Dubai Creek Harbour accounted for 2.7% of Dubai residential Unit and Villa transactions in 2026 to 23 October, compared with 2.1% in 2025. Its highest share in this series was 4.6% in 2022. For another DLD-based district comparison, see JVC transaction and price data.
Ejari rents and the limits of rental-yield calculations
Rental figures are annual contract amounts from residential Ejari contracts, including both new contracts and renewals. The year is the start year of the contract. The sample includes apartments and studios recorded as either Flat or Studio, subject to stated area and annual-rent filters.
| Contract start year | Type | Contracts | Median annual rent, AED | Median area, m² | Median annual rent, AED/m² |
|---|---|---|---|---|---|
| 2025 | 1 bedroom | 2,296 | 100,000 | 67.0 | 1,429 |
| 2025 | 2 bedrooms | 2,358 | 150,000 | 105.0 | 1,394 |
| 2025 | 3 bedrooms | 847 | 220,000 | 153.0 | 1,384 |
| 2025 | 4 bedrooms | 42 | 447,500 | 280.5 | 1,441 |
| 2026 to 23 October | 1 bedroom | 2,025 | 95,000 | 66.6 | 1,374 |
| 2026 to 23 October | 2 bedrooms | 2,123 | 145,000 | 104.6 | 1,332 |
| 2026 to 23 October | 3 bedrooms | 790 | 210,000 | 153.7 | 1,338 |
The 2026 medians are below 2025 for all three main apartment types shown. One-bedroom median annual rent moved from AED 100,000 to AED 95,000; two-bedroom rent from AED 150,000 to AED 145,000; three-bedroom rent from AED 220,000 to AED 210,000. The AED-per-m² medians also declined for these types.
A headline rental yield is difficult to treat as the result for a specific Creek Harbour apartment because sale and rental samples are independent. The sale median includes a high share of under-construction homes, while rental contracts concern completed homes that can actually be occupied. The bedroom medians also combine different buildings, handover years and apartment configurations.
| Year | Type | Median sale price, AED | Median annual rent, AED | Gross yield | Check by AED/m² |
|---|---|---|---|---|---|
| 2025 | 1 bedroom | 1,910,399 | 100,000 | 5.2% | 5.2% |
| 2025 | 2 bedrooms | 2,967,888 | 150,000 | 5.1% | 5.5% |
| 2025 | 3 bedrooms | 4,124,888 | 220,000 | 5.3% | 5.6% |
| 2026 to 23 October | 1 bedroom | 1,937,888 | 95,000 | 4.9% | 4.9% |
| 2026 to 23 October | 2 bedrooms | 3,232,888 | 145,000 | 4.5% | 5.0% |
| 2026 to 23 October | 3 bedrooms | 4,400,000 | 210,000 | 4.8% | 5.1% |
These are gross market indicators: median annual rent divided by median sale price for the same bedroom type and year. They are before service charges, agency costs, vacancy between tenants and the 4% DLD fee payable on purchase. They are not a net yield, do not include financing, and do not establish the return of an individual apartment.
Service charges can change the result materially because they are paid at property level and are not included in the table. For the method of moving from gross rent to a property-specific estimate, see service charges and property returns and the guide to calculating net apartment yield.
Off-plan and Existing properties
Off-plan represented 70.3% of recorded Dubai Creek Harbour sales in 2026 to 23 October: 2,166 transactions out of 3,079. Existing Properties accounted for 913 transactions, or 29.7%. Across the trailing 12 months to 23 October 2026, the off-plan share was 68.8%.
“Existing” does not mean every transaction was a resale between private owners. The registration category can also include a first sale of a completed apartment by a developer. The available records cannot separate those two situations, so the Existing share should not be described as a pure resale share.
For an off-plan buyer, the core distinction is timing: the registered sale median includes apartments that may not yet be available for rental, while Ejari rent records relate to completed homes. That is why the gross-yield table is an orientation tool rather than a calculation for a particular off-plan contract.
A broker does not receive client money: payments go to the developer’s escrow account or through a DLD trustee office.
Where the highest number of sales was recorded
The following order is based only on the number of registered transactions during the 12 months from 24 October 2025 to 23 October 2026. It is an activity order, not an assessment of any building, project, developer or apartment.
| Building name in the register | Sales | Median price, AED | Median price, AED/m² | Off-plan share |
|---|---|---|---|---|
| Lyvia by Palace | 464 | 2,910,490 | 28,788 | 100% |
| Valia – Tower | 417 | 2,310,888 | 27,899 | 100% |
| Creek Bay Tower A | 399 | 3,327,888 | 29,505 | 100% |
| Creek Bay Tower B | 302 | 3,267,888 | 29,410 | 100% |
| Creek Haven Tower A | 249 | 2,797,888 | 28,853 | 100% |
| Creek Haven Tower B | 224 | 1,972,888 | 28,949 | 100% |
| Montiva | 165 | 2,868,888 | 27,046 | 100% |
| Silva | 137 | 3,127,888 | 24,010 | 100% |
| The Grand | 91 | 3,150,000 | 29,226 | 0% |
| Palace Residences – North | 80 | 2,570,000 | 28,527 | 0% |
These ten building-name entries accounted for 2,528 sales, or 64.4% of the 3,926 transactions in the period. Names are reproduced as they appear in the register. A single tower can appear under separate labels, such as blocks A and B, so names should be checked against the documents for the apartment being considered.
At project level, the largest recorded transaction counts were Creek Bay with 701 sales, Creek Haven with 473, Lyvia by Palace with 464, Valia with 419 and Montiva with 165. Creek Bay, Creek Haven, Lyvia by Palace and Valia were recorded as 100% off-plan in this 12-month project table.
What the registry does not show
What the registry does not show: peak-hour traffic, parking, noise, nearby construction timelines and the condition of a specific building are not in DLD data. Those are checked on site and in the building’s documents; the registry only shows prices, deals and rents.
70.3% of 2026 sales to 23 October (2,166 of 3,079) were registered as Off-Plan Properties. This is the registration type of the sale, not a measure of how much of the district is completed.
The figures show 913 Existing transactions in 2026 to 23 October and 4,938 Ejari apartment contracts starting in 2026 across the one-, two- and three-bedroom categories shown. They do not show how many apartments were vacant, how quickly a specific apartment was rented, or whether a particular building is quieter or busier than another.
By price structure, the recorded market is concentrated in one- and two-bedroom apartments. A buyer focused on a roughly AED 1.9 million one-bedroom median, a roughly AED 3.2 million two-bedroom median, or a roughly AED 4.4 million three-bedroom median can use those ranges to frame a search, then narrow it by readiness and documents. Buyers who want completed homes can begin with the catalogue of ready apartments.
To compare Dubai Creek Harbour with other areas against your budget, intended holding format and preference for ready or off-plan property, use the guide to choosing an area in Dubai.
See also: all 18 districts by DLD data · Dubai Marina in DLD numbers · Dubai Hills Estate in DLD numbers.
See also: Dubai’s future metro: Blue Line, Gold Line and DLD sales in areas on the route.
Frequently asked questions
How much did a one-bedroom apartment cost in Dubai Creek Harbour in 2026?
For registered sales to 23 October 2026, the one-bedroom median was AED 1,937,888, with a median area of 70.0 m² and AED 27,843 per m² across 1,299 sales.
What is the 2026 price of a two-bedroom apartment?
The two-bedroom median was AED 3,232,888 for 115.3 m², or AED 26,810 per m², based on 1,339 sales to 23 October 2026.
Is there a registered Creek Harbour studio price median?
No. The sales breakdown by bedroom count has no studio row, so no studio median is shown.
How much of Dubai Creek Harbour is still off-plan?
Off-plan transactions represented 70.3% of sales in 2026 to 23 October: 2,166 of 3,079 sales. In the trailing 12 months to 23 October 2026, the share was 68.8%.
What are current recorded rents?
For contracts starting in 2026 to 23 October, median annual rent was AED 95,000 for one-bedroom apartments, AED 145,000 for two-bedroom apartments and AED 210,000 for three-bedroom apartments.
What is the rental yield in Dubai Creek Harbour?
The 2026 gross median-based calculation was 4.9% for one-bedroom apartments, 4.5% for two-bedroom apartments and 4.8% for three-bedroom apartments. It is before service charges, vacancy, commissions and the 4% DLD purchase fee, and it combines separate sale and rental samples.
Discuss a purchase in Dubai
If you are considering a purchase, arrange a free consultation to go through the property, the transaction steps and the documents.
PDF shortlist · updated 27 October 2026
New Dubai projects of October 2026
30 projects · prices from DLD and developers
30 more in the PDF: prices, handover dates, payment plans
The PDF opens instantly. Refreshed monthly from DLD data.