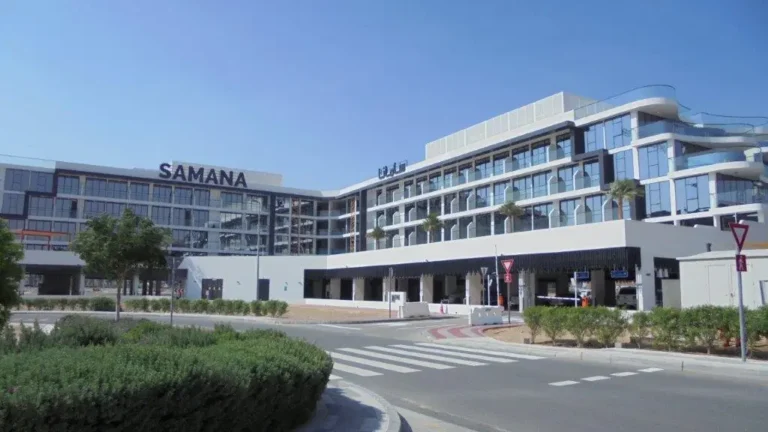
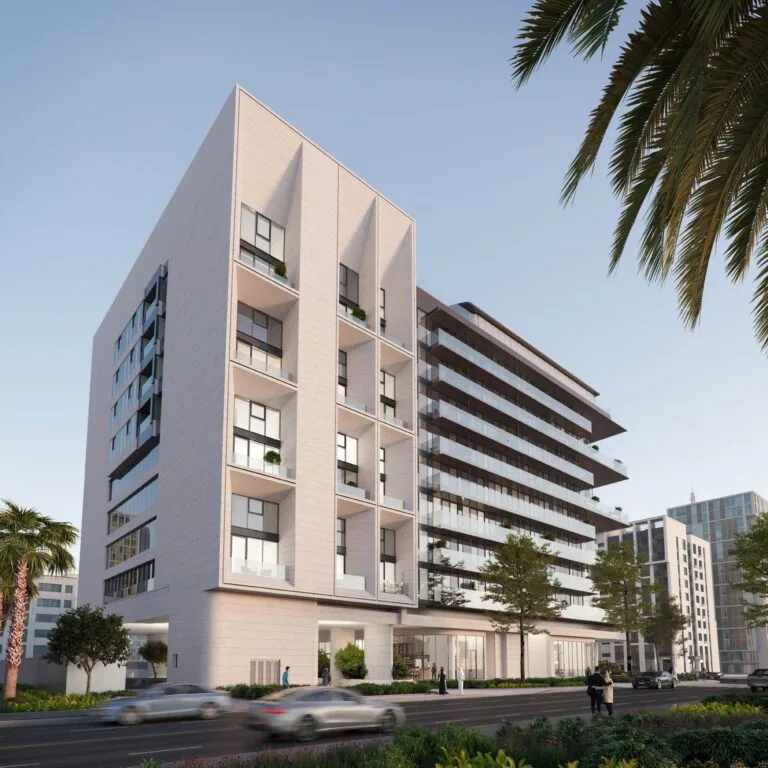
1. Definition of the area and data structure
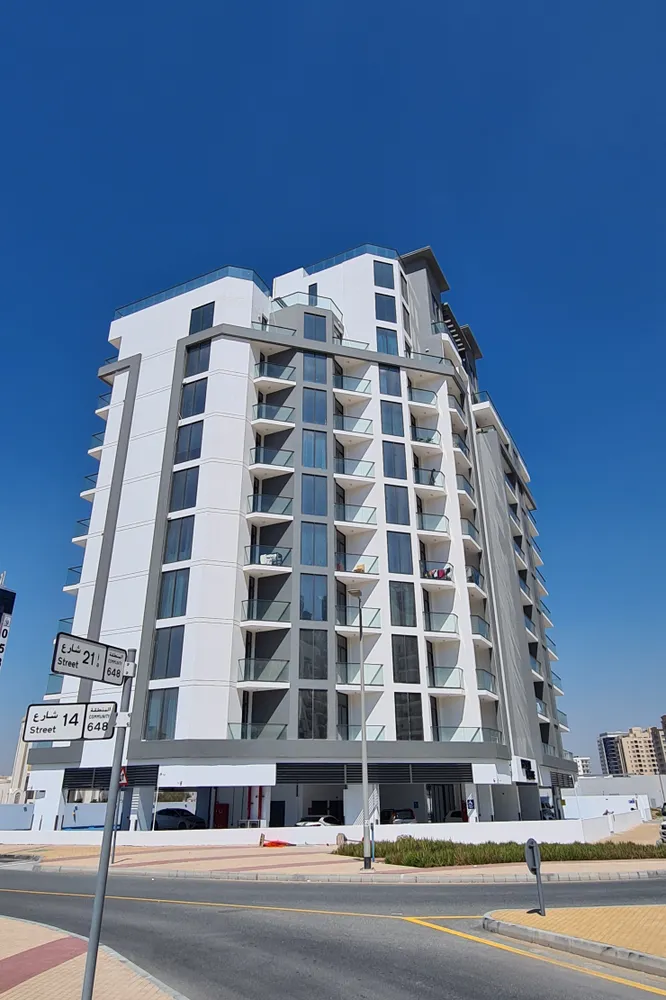
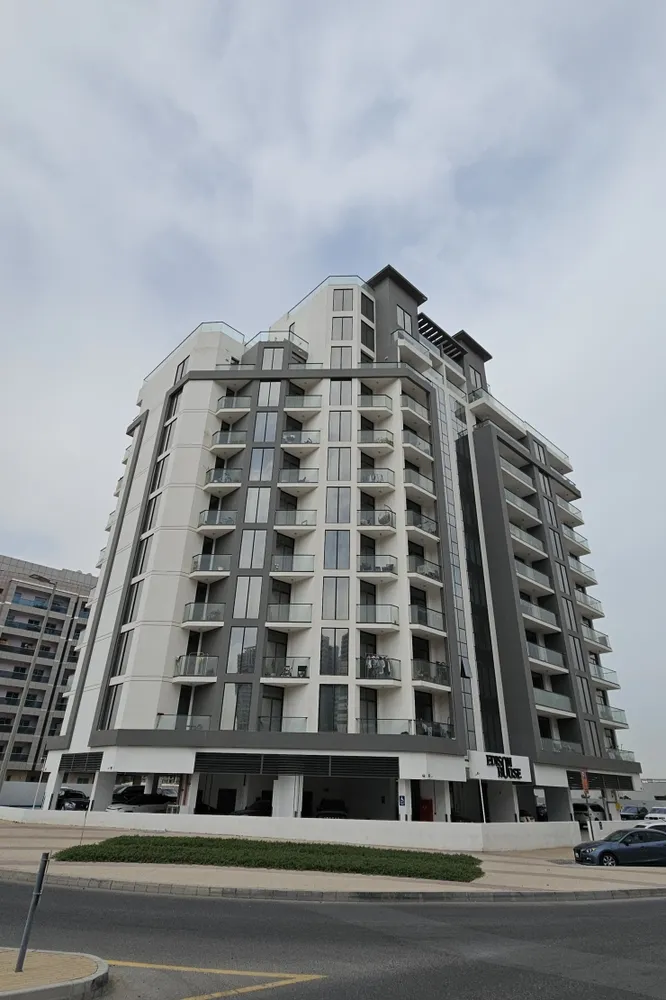
Actual location: according to the DLD database, EDISON HOUSE belongs to the Wadi Al Safa 5 district and the Dubai Land Residence Complex master project. All area calculations and comparative analysis are based exclusively on these parameters, confirmed by open DLD transactions.
Based on the analysis of the data structure, the DLD database records 106 transactions for residential apartments (type Flat) in EDISON HOUSE. There is no separate specification for one-bedroom apartments (1BR), so the analysis below covers the entire pool of apartments in the building and compares it with the wider area.
2. Liquidity analysis (transaction volume and frequency, rentals)
Transaction activity in EDISON HOUSE started in Q2 2022. In the peak periods (Q2–Q4 2022), up to 28 transactions per quarter were recorded in the building, indicating strong primary demand at the time of the project’s launch. In 2023–2024, volumes have been gradually declining, reflecting the natural saturation of a new development.
Over the same period, around 80 rental contracts of all apartment types have been recorded in EDISON HOUSE, which provides a sufficient sample to assess rental dynamics. For Wadi Al Safa 5, the sample is even broader.
3. Sale price dynamics and levels (AED/m²) for the building and the area
For EDISON HOUSE, the average transaction price per square metre over the last 12 months is about 9,343 AED/m² for flat-type apartments, which corresponds to the upper part of the average price range for the area over the same period (14,031 AED/m²).
Since 2022, average prices per m² in the building have shown moderate growth: from approximately 7,300–8,000 AED/m² in 2022 to peak values of 11,365 AED/m² in Q2 2024, followed by a correction (8,499 AED/m² in Q4 2024). Across Wadi Al Safa 5, there has been an overall increase from average levels of 6,000–7,000 AED/m² (2022–2023) to an accelerated 12,000–15,000 AED/m² in 2024–2025 (based on the most recent registrations).
Important note: recent transactions in the building may be subject to registration delays, and some extreme price points may reflect the specifics of individual deals or bulk packages (typical for mass-market projects).
4. Rental rate dynamics and levels (AED/m² per year) for the building and the area
Rental activity in EDISON HOUSE has been consistently reflected in a stable flow of contracts since 2023. The average annual rental rate for the entire building over the last 12 months is 639 AED/m². For comparison, the average level of contracts in Wadi Al Safa 5 over the same period is significantly higher at 769 AED/m², indicating stronger overall demand at the area level.
The dynamics are as follows: in the building, rental values per m² range from 557 to 676 AED/m² by quarter, without sharp spikes but with a slight upward trend. Across the area, values have been gradually increasing over the last year from 650 to 790 AED/m².
5. Comparative analysis of returns (ROI) and the “investment fair price range”
Based on 12‑month averages for the building:
– Average purchase price: 9,343 AED/m²
– Average annual rent: 639 AED/m²
– Gross ROI for the building: 6.8% (639 ÷ 9,343)
Taking into account typical entry costs (7–8%), the adjusted net yield for the building is estimated at around 6.3–6.4%.
For the area:
– Average purchase price: 14,031 AED/m²
– Average rent: 769 AED/m²
– Gross ROI for the area: 5.5%
– Net ROI for the area: approximately 5.0–5.1% (including costs)
If we target an annual yield of 7–8% (the expectation of most investors in Dubai Land Residence Complex), then the “investment fair price range” for the building is:
– For 7% ROI: 639 ÷ 0.07 ≈ 9,129 AED/m²
– For 8% ROI: 639 ÷ 0.08 ≈ 7,988 AED/m²
The current average price in the building is above the level at which a 7–8% ROI can be expected — to reach such returns, an investor would need either a modest discount from current market prices or to rely on further growth in rental demand. Across the area as a whole, the current price level already implies only about 5–5.5% gross ROI, i.e. the building looks slightly more attractive in terms of yield compared to the “older stock”, but still falls short of the 7–8% annual investment benchmark.
6. Conclusions for the investor
In recent quarters, EDISON HOUSE has shown stable but moderately declining liquidity: the peak was at project launch, while current sales are proceeding in smaller batches. Rental market activity is steady, which is positive for a buy‑to‑let investment strategy. However, current price levels in the building (around 9,300 AED/m²) translate into a yield in the range of 6.3–6.8% gross/net, which is below the 7–8% return targeted by most market participants.
To achieve a more attractive yield, either a price correction from sellers or additional growth in rental rates driven by the commissioning of new infrastructure in the area will be required. Compared with the wider area, EDISON HOUSE offers slightly higher returns and similar liquidity levels, while the broader market dynamics in Wadi Al Safa 5 are characterised by faster growth in both transaction prices and rental rates.
Over a 3–5 year horizon, sustained tenant demand and gradual rental growth can be expected, but investors should factor in the potential compression of gross ROI if sale prices continue to rise without a corresponding acceleration in rents.
Related Articles
- ROI analysis of apartment in Nicholas Residence: DLD data and real deals
- ROI analysis of apartment in Binghatti Phoenix: DLD data and real deals
- ROI analysis of apartment in TOPAZ RESIDENCES 1: DLD data and real deals — 26.01.2026 #18390
- Shared Rental Housing and Joint Property Insurance in the UAE
- ROI analysis of apartment in Azizi Riviera 37: DLD data and real deals