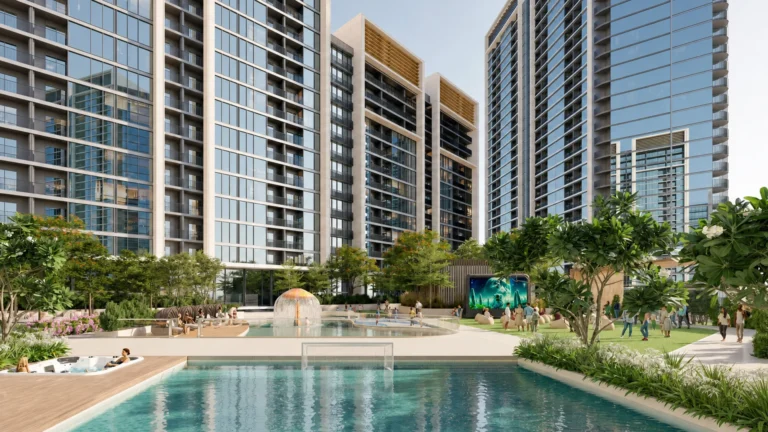
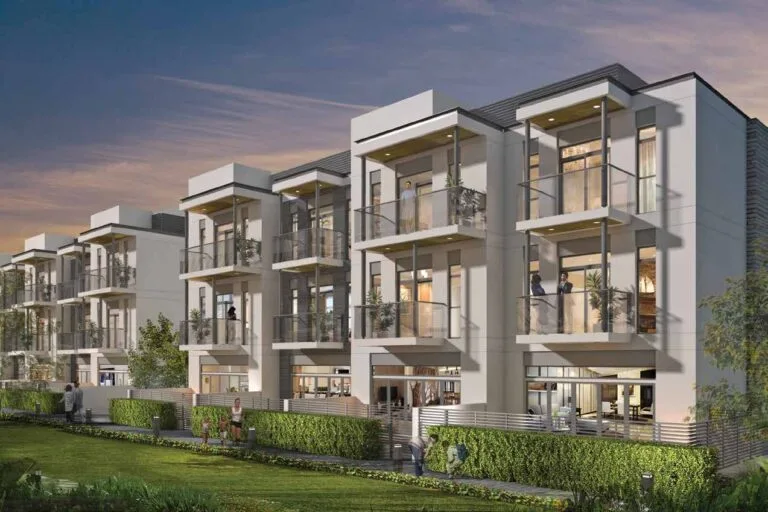
Developer: Sobha Group · Mohammed Bin Rashid City
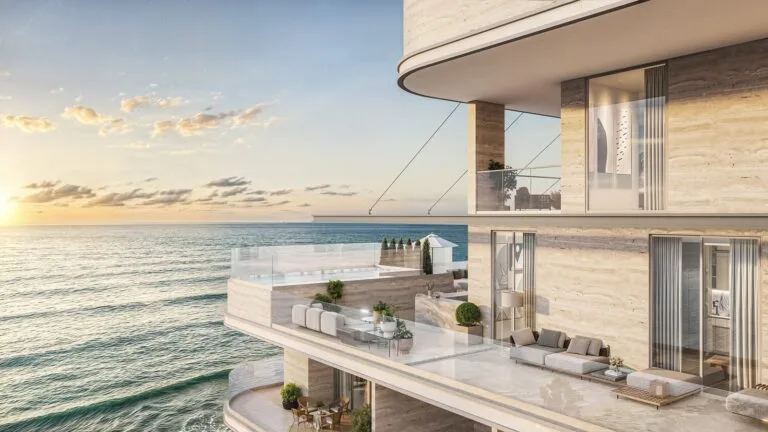
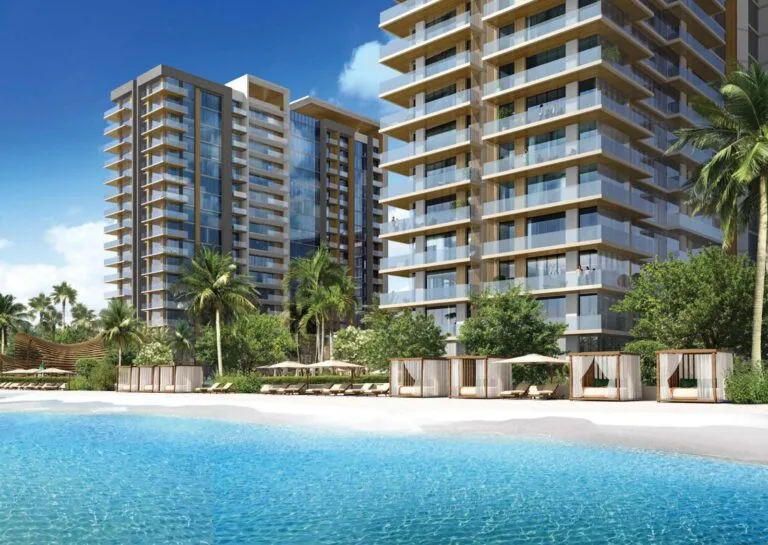
Sobha Hartland Waves is a residential project by Sobha Group in Mohammed Bin Rashid City, Dubai, with construction 100% complete per the DLD registry, 604 units, 904 DLD-registered sales since 2021.
Every figure carries its origin: “DLD registry” is taken from the Dubai Land Department register, “Developer supplied” is stated by the developer, “Our calculation” is computed by us from the first two. Developer prices change without notice — confirm before you commit. Methodology
| Type | Units | Typical size, sq.ft |
|---|---|---|
| 1 Bedroom | 437 | 501–643 |
| 2 Bedroom | 155 | 851–1 203 |
| Other units | 12 | 447–2 001 |
Size range excludes the smallest and largest 5% of units of each type.
All units are freehold. Data from the DLD registry.
For UAE residents the down payment starts at 20% with terms up to 25 years. Estimate your payment and purchase costs for your budget.
Estimates only; not a bank approval.
Data from the Dubai Land Department project registry (updated 11.10.2026 09:55).
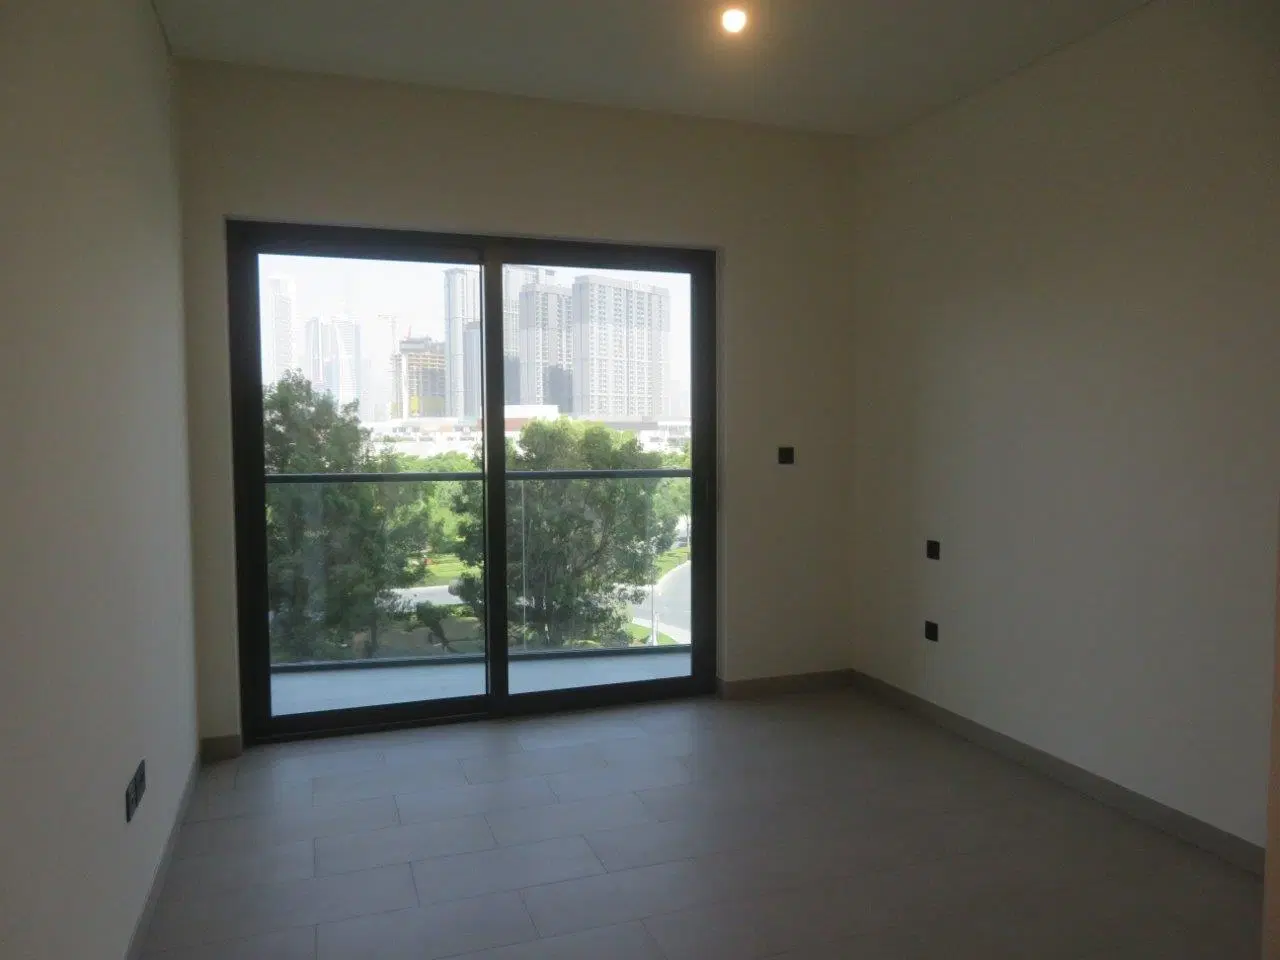
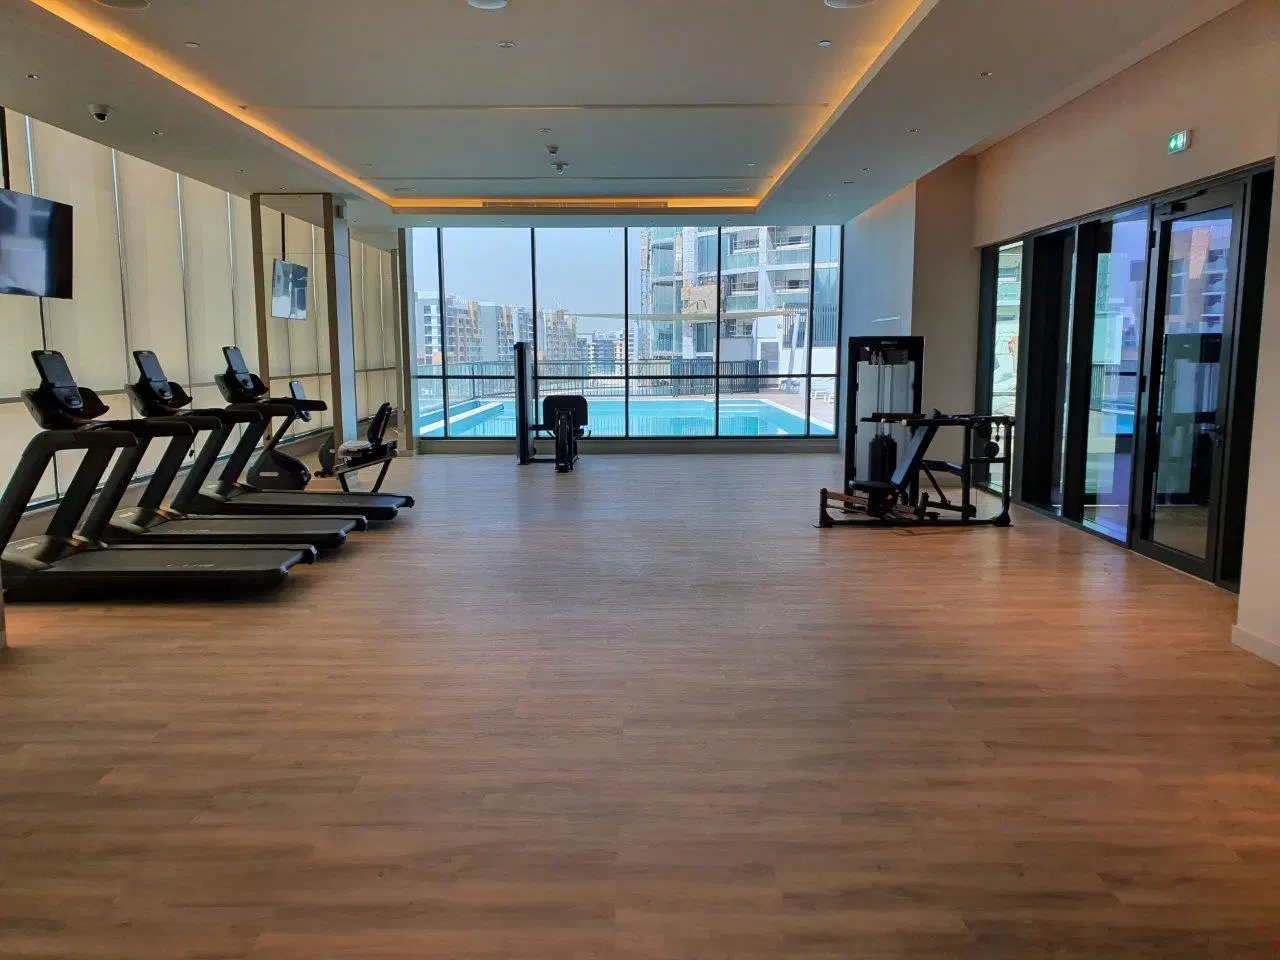
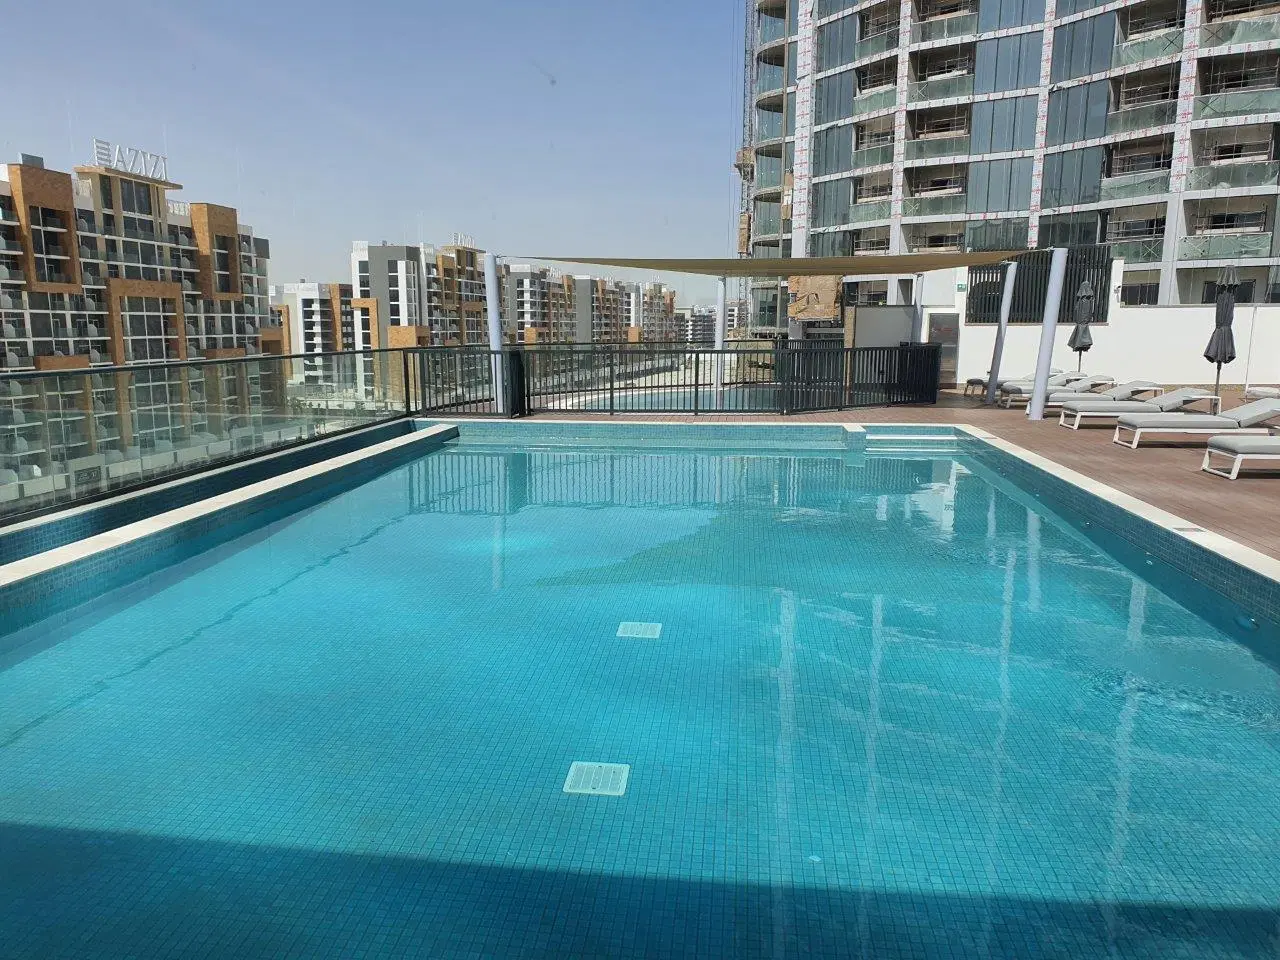
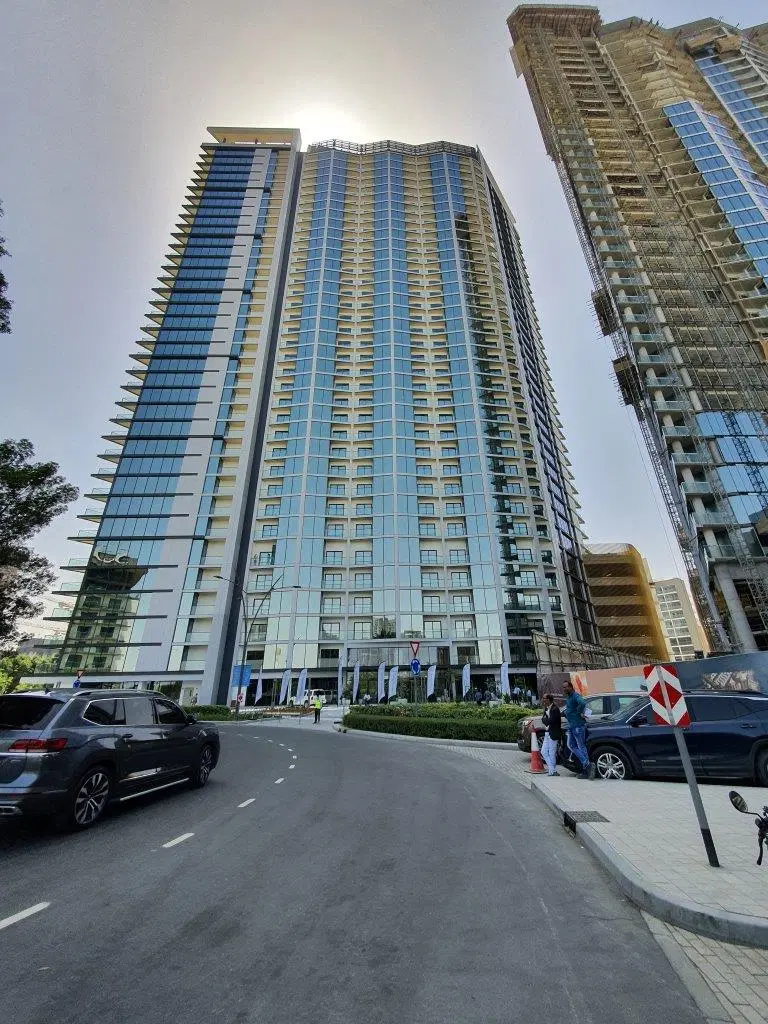
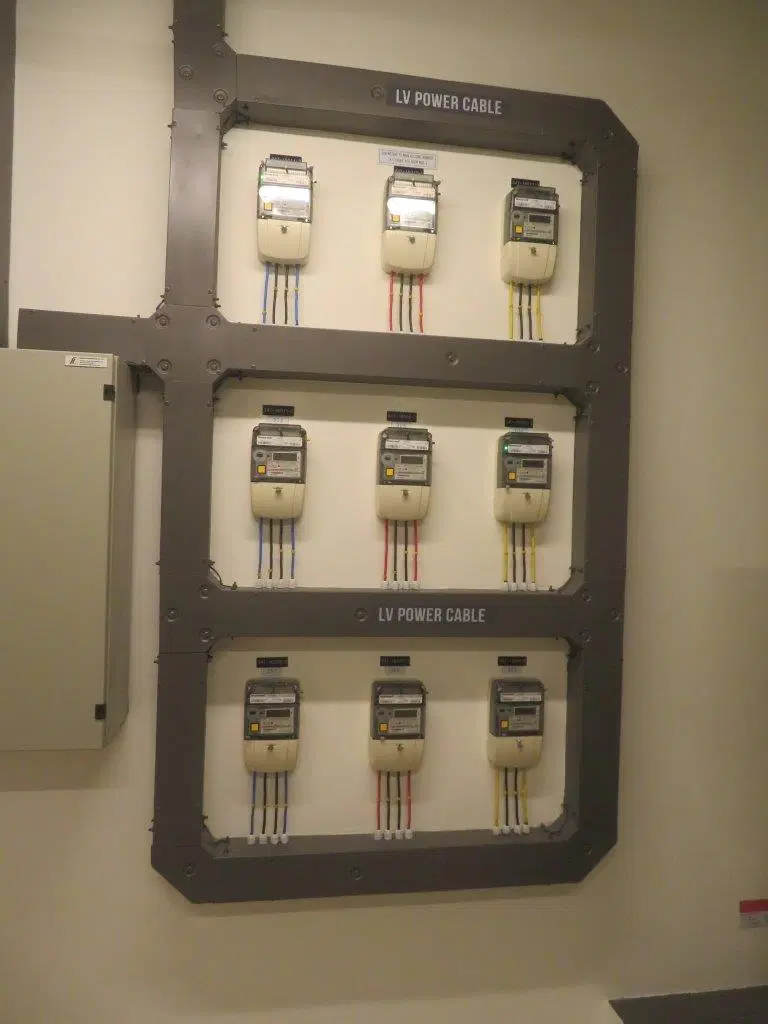
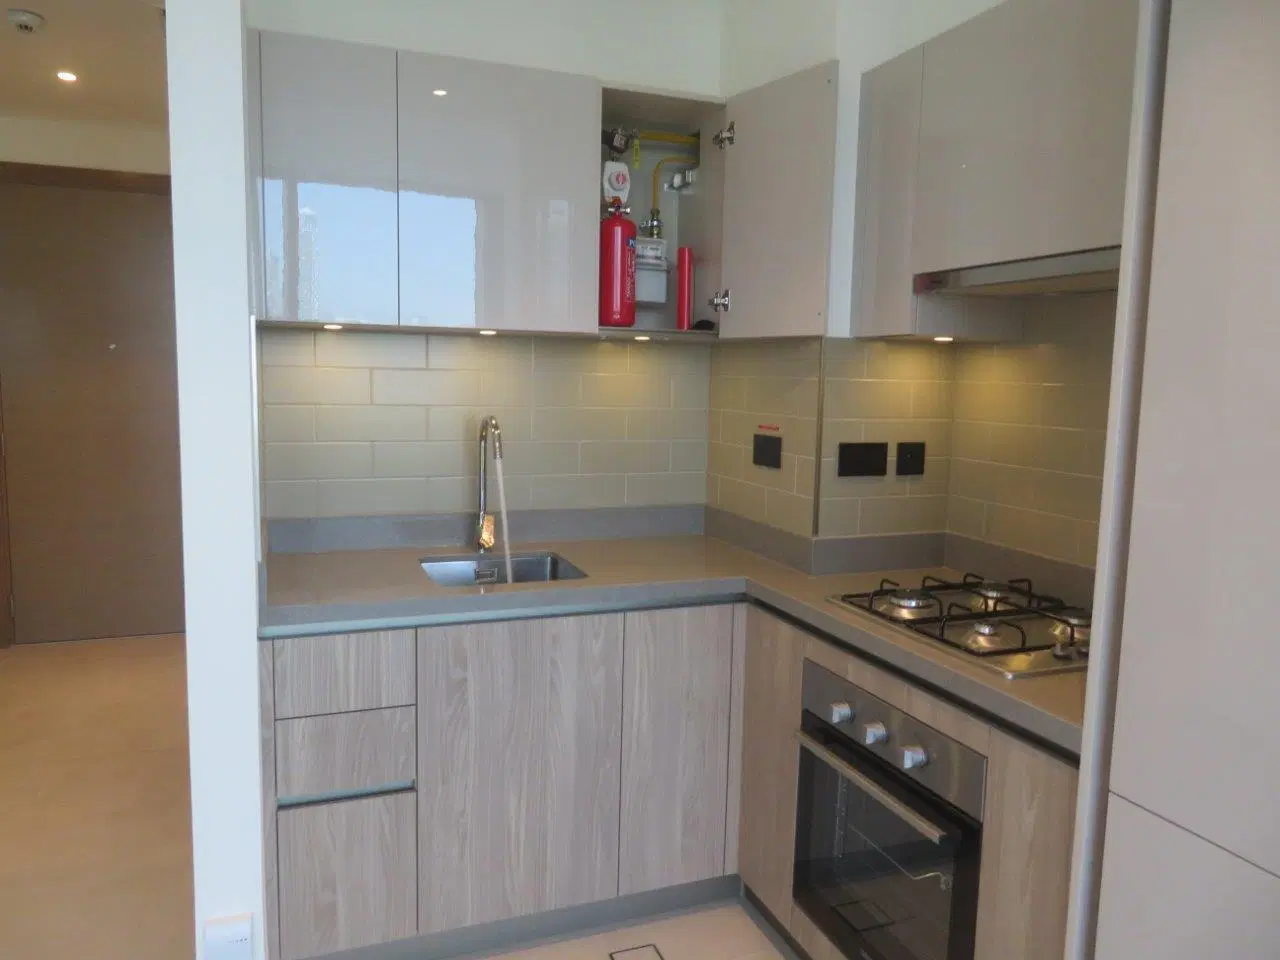
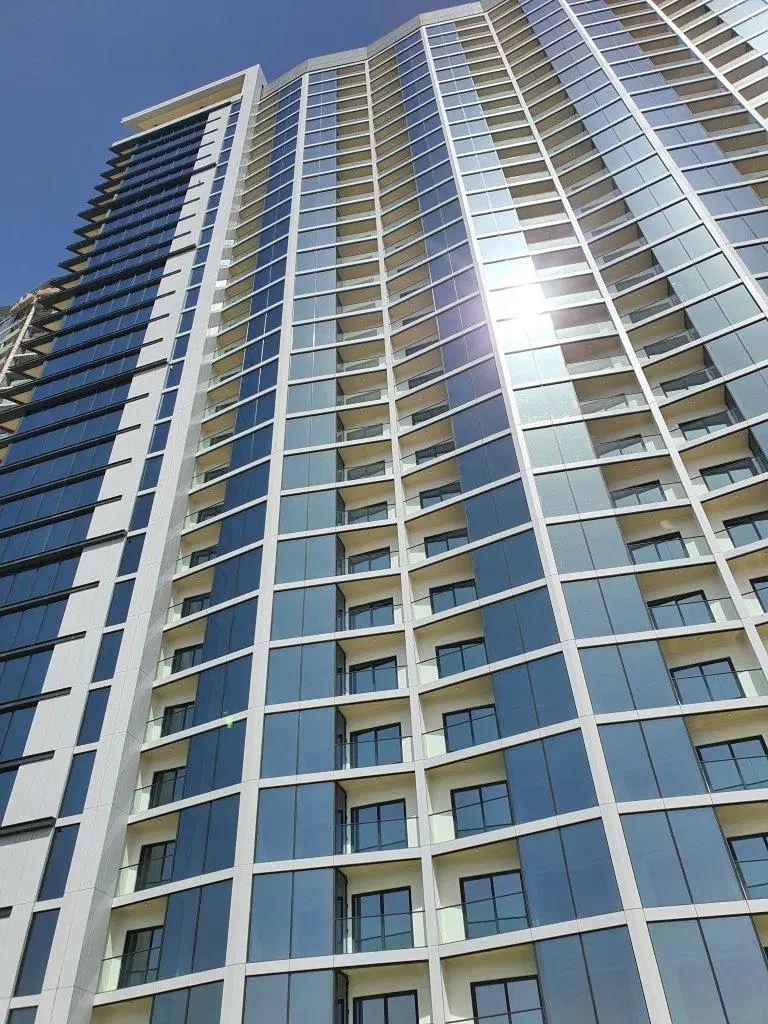
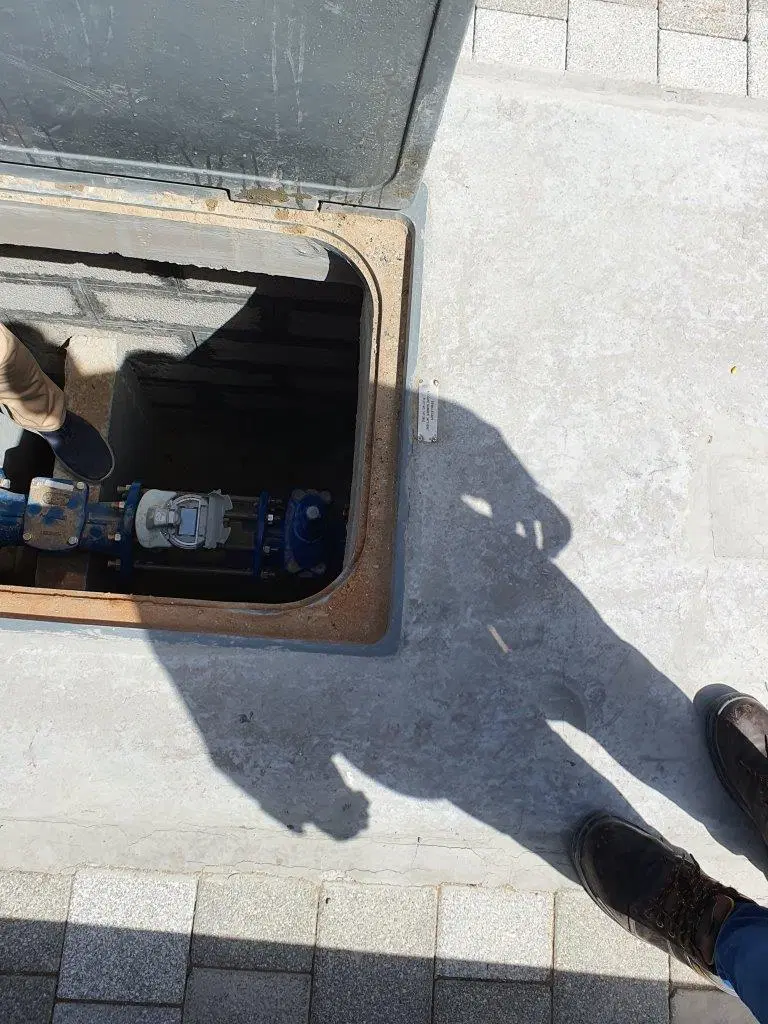
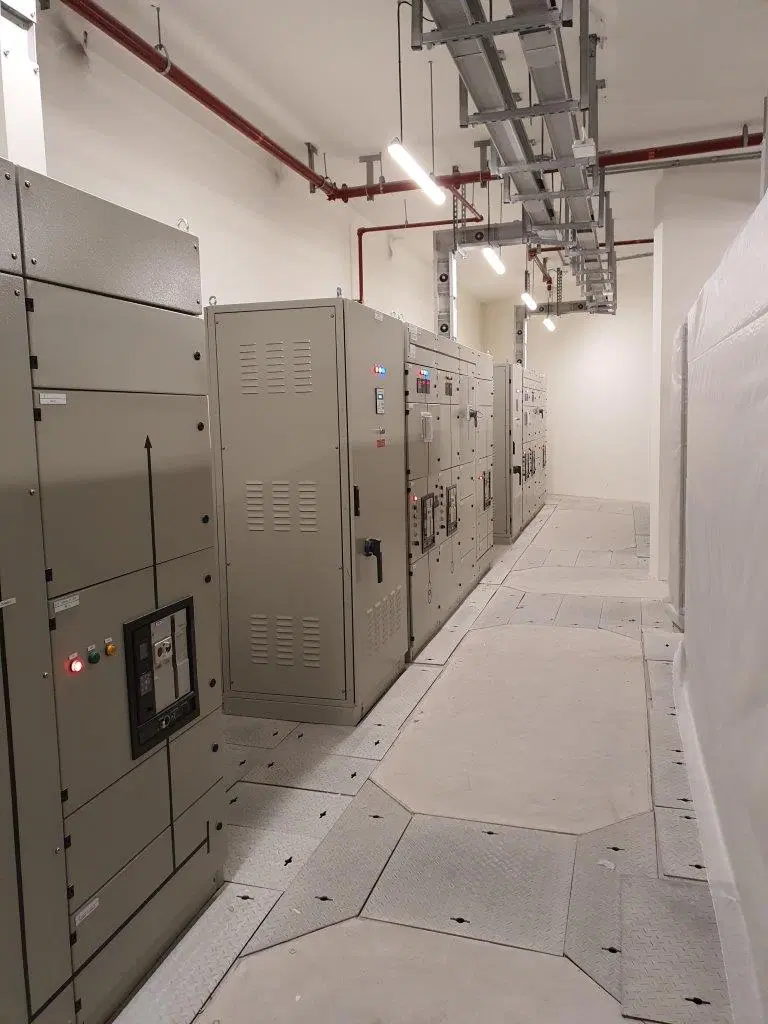
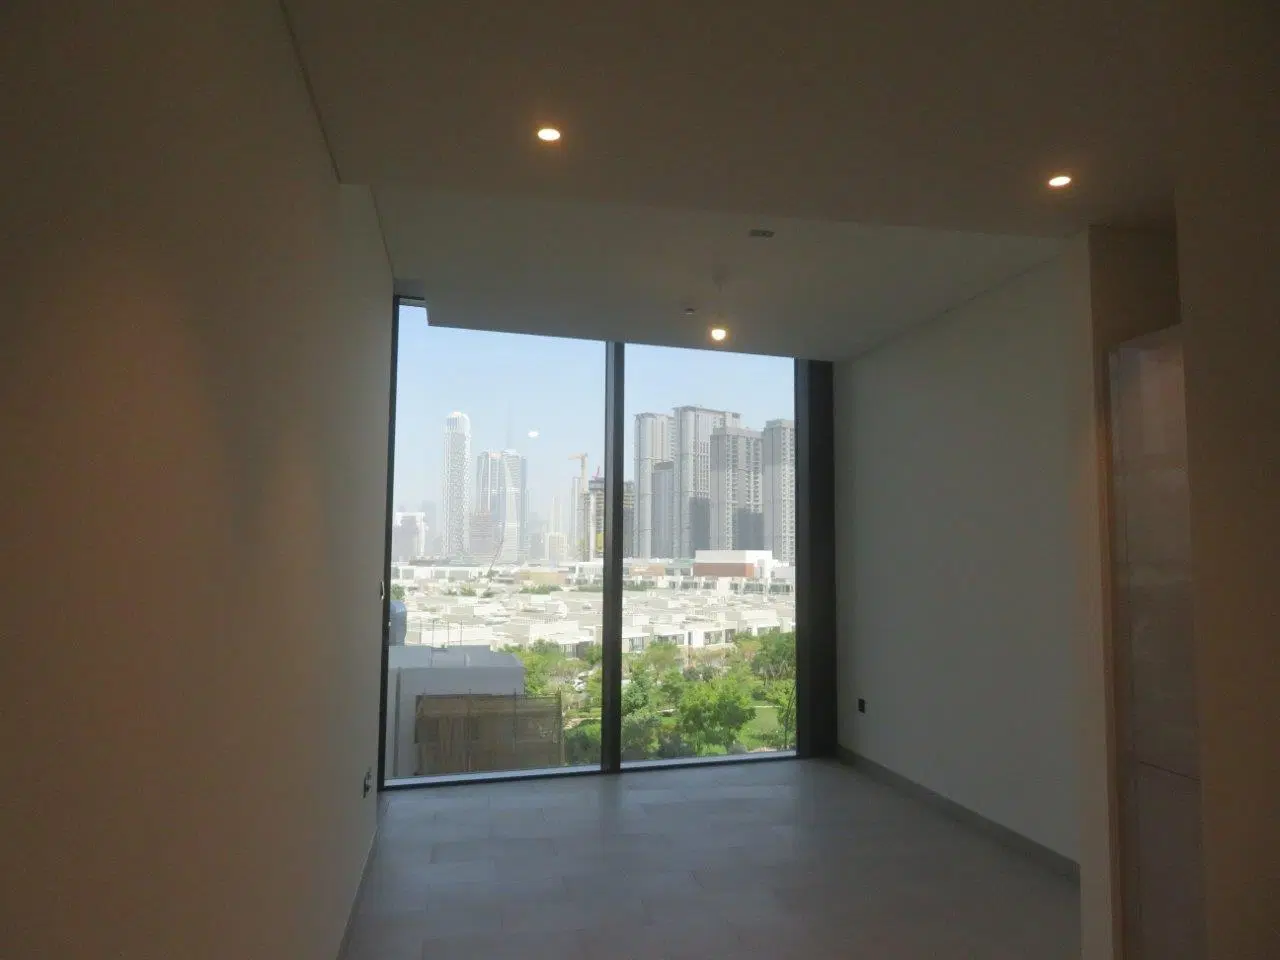
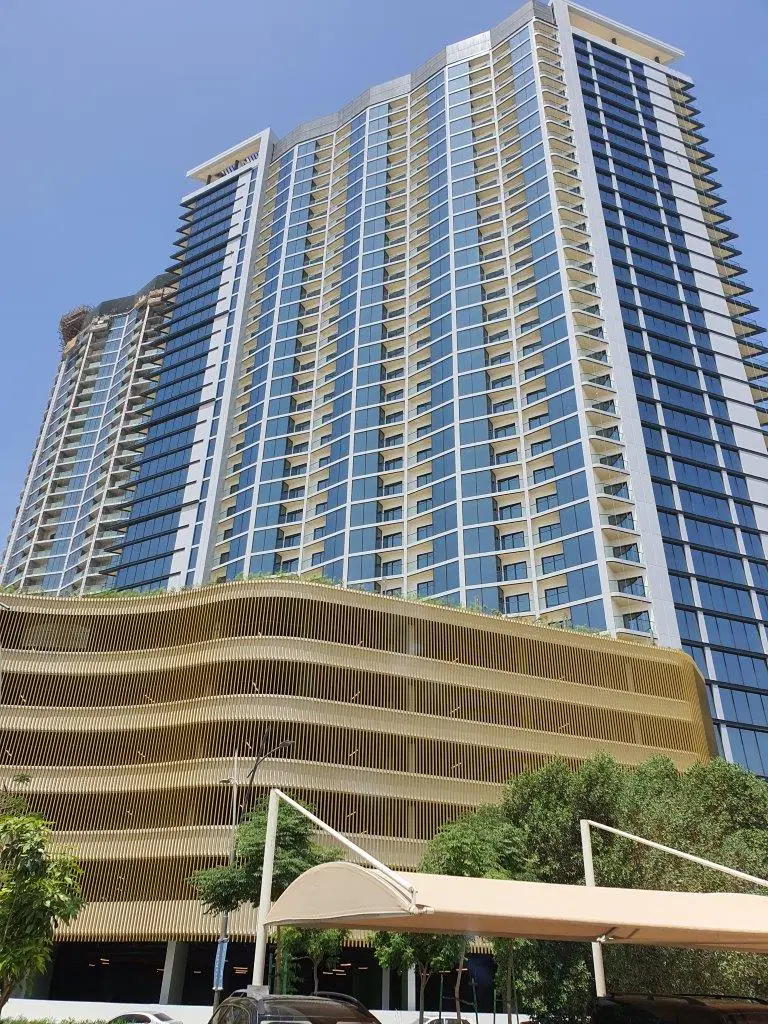
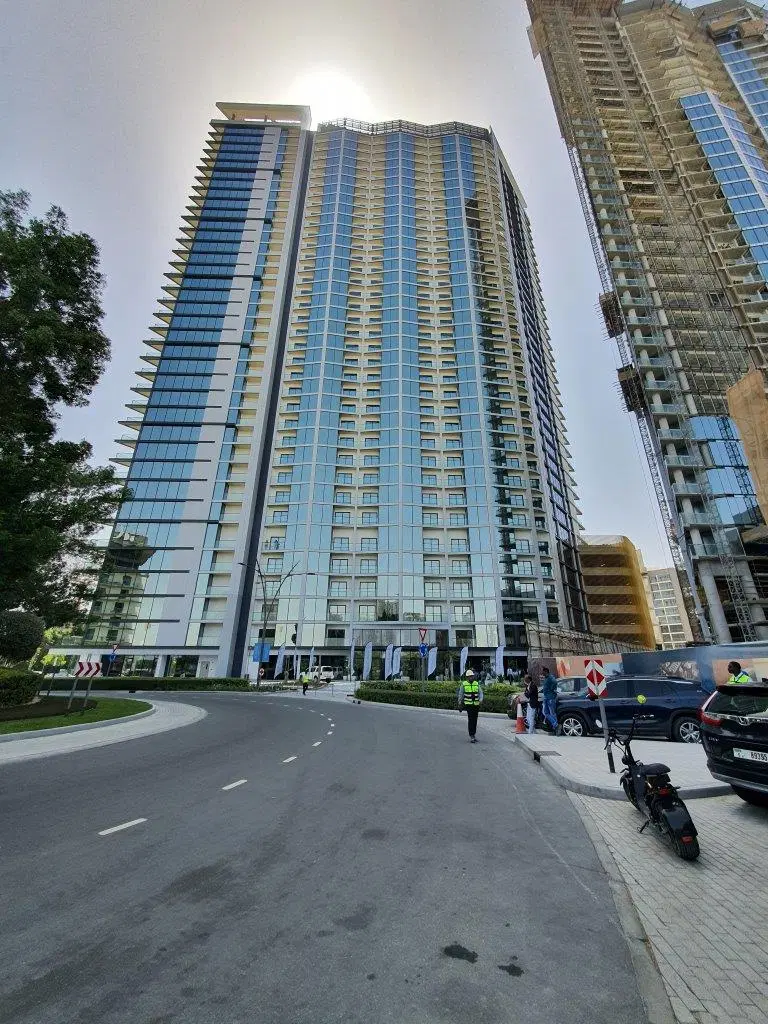
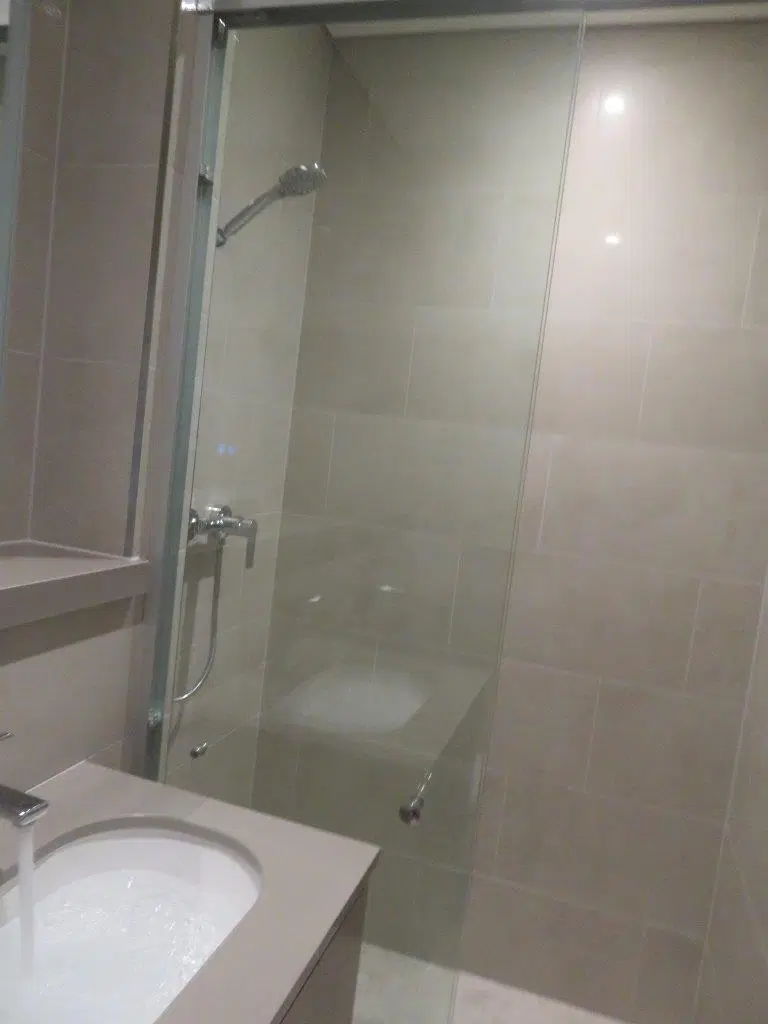
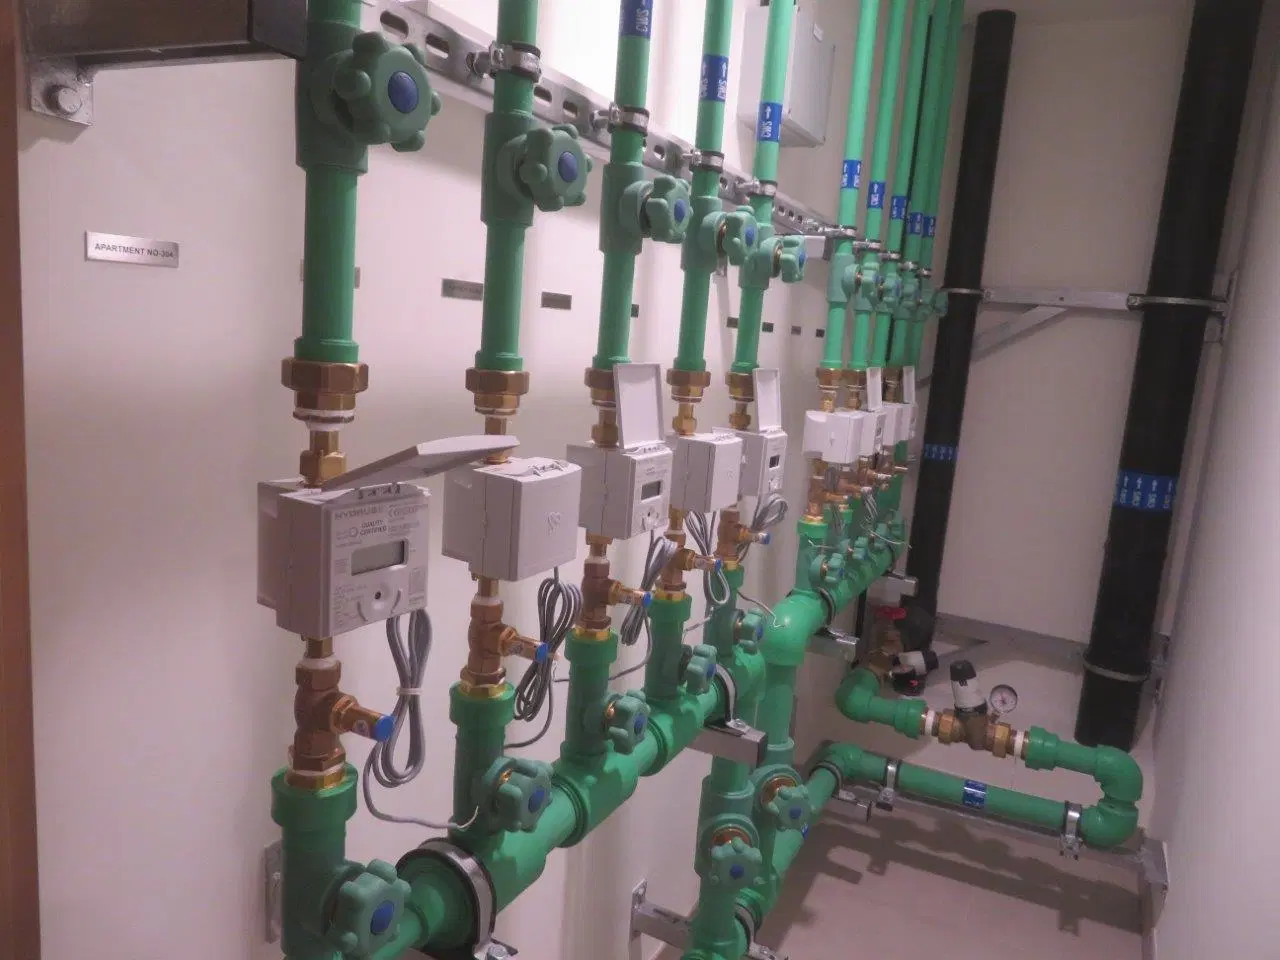
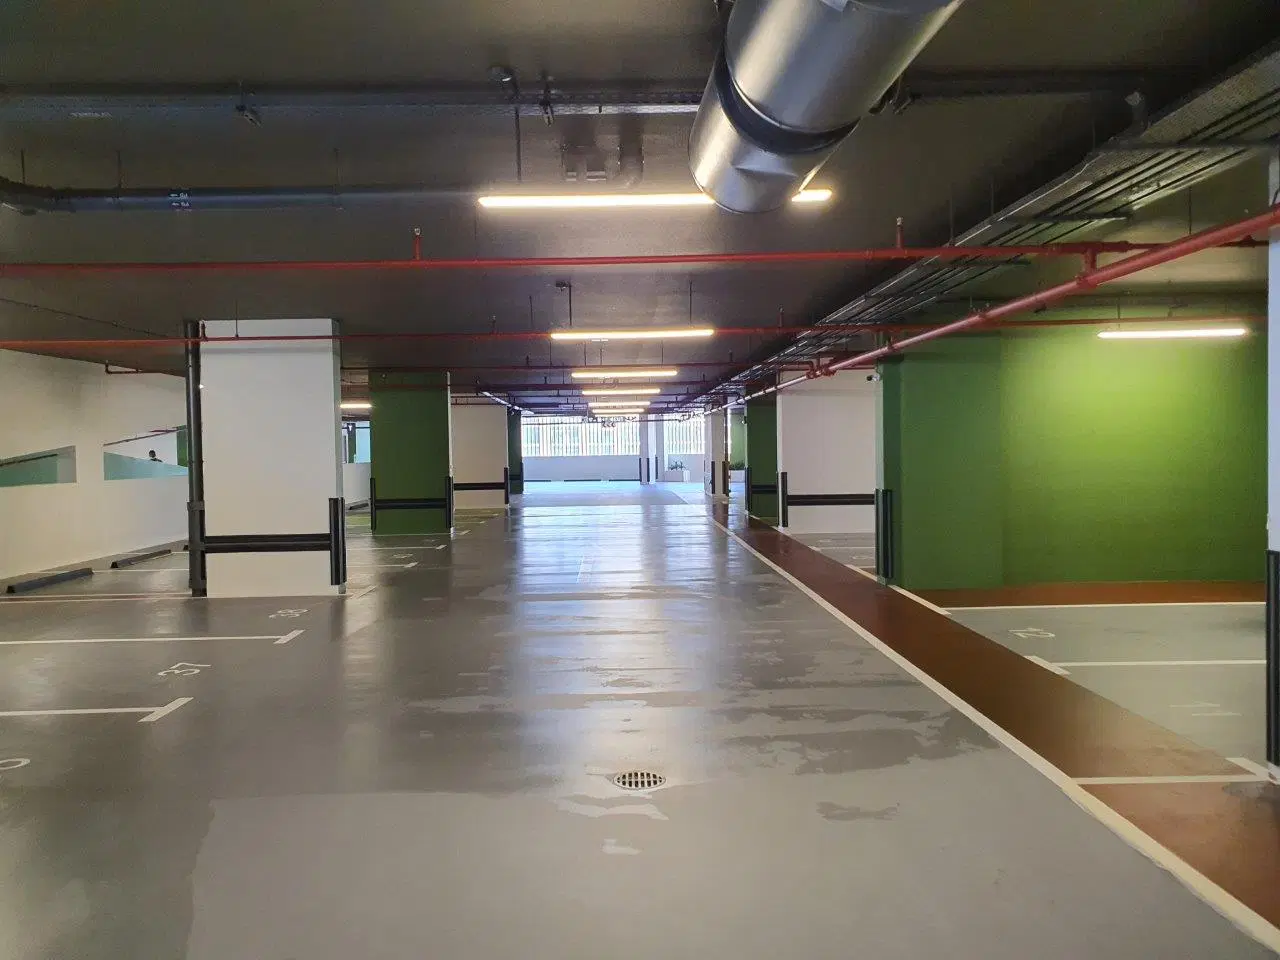
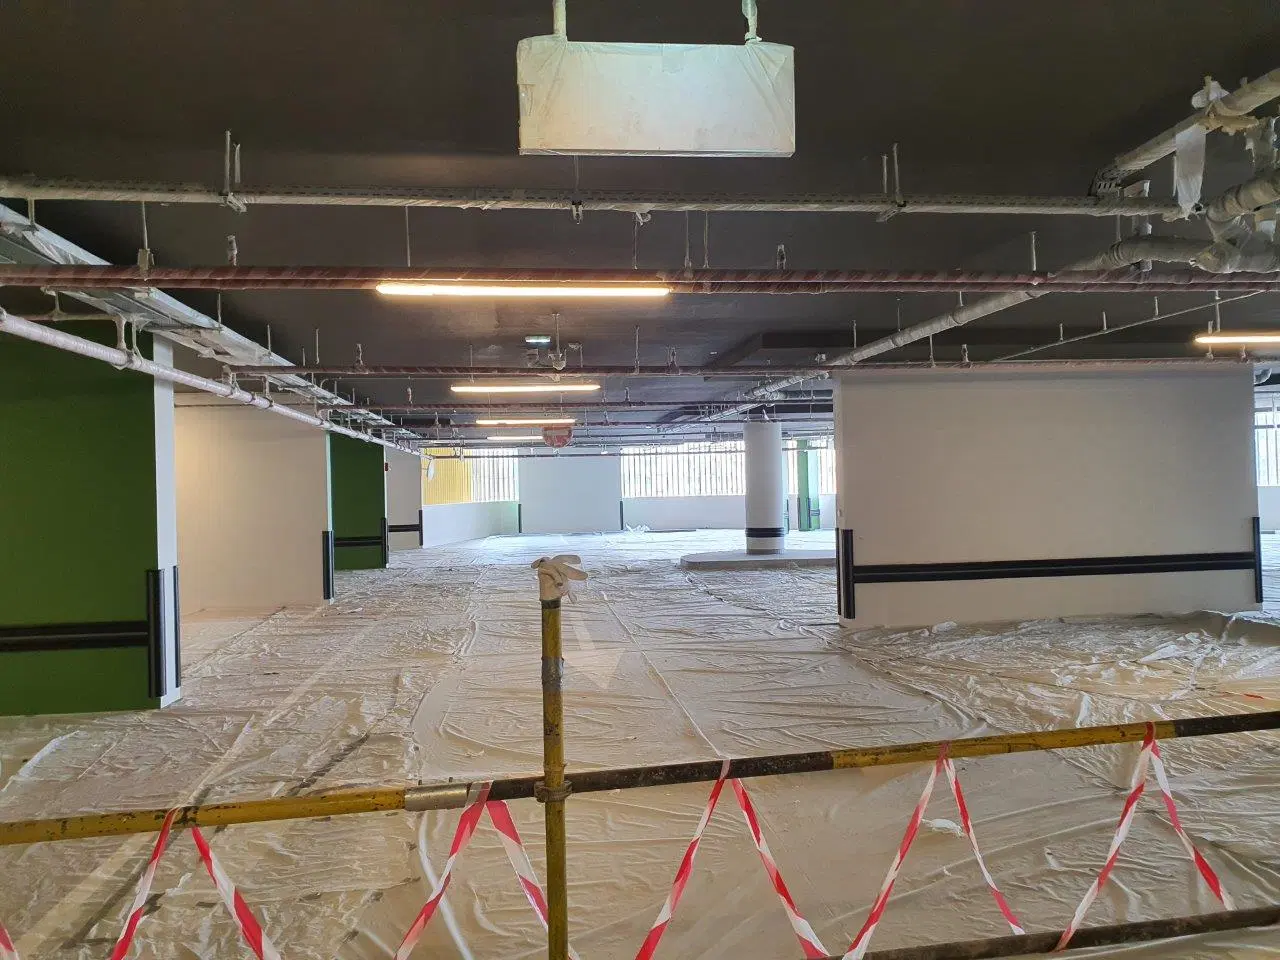
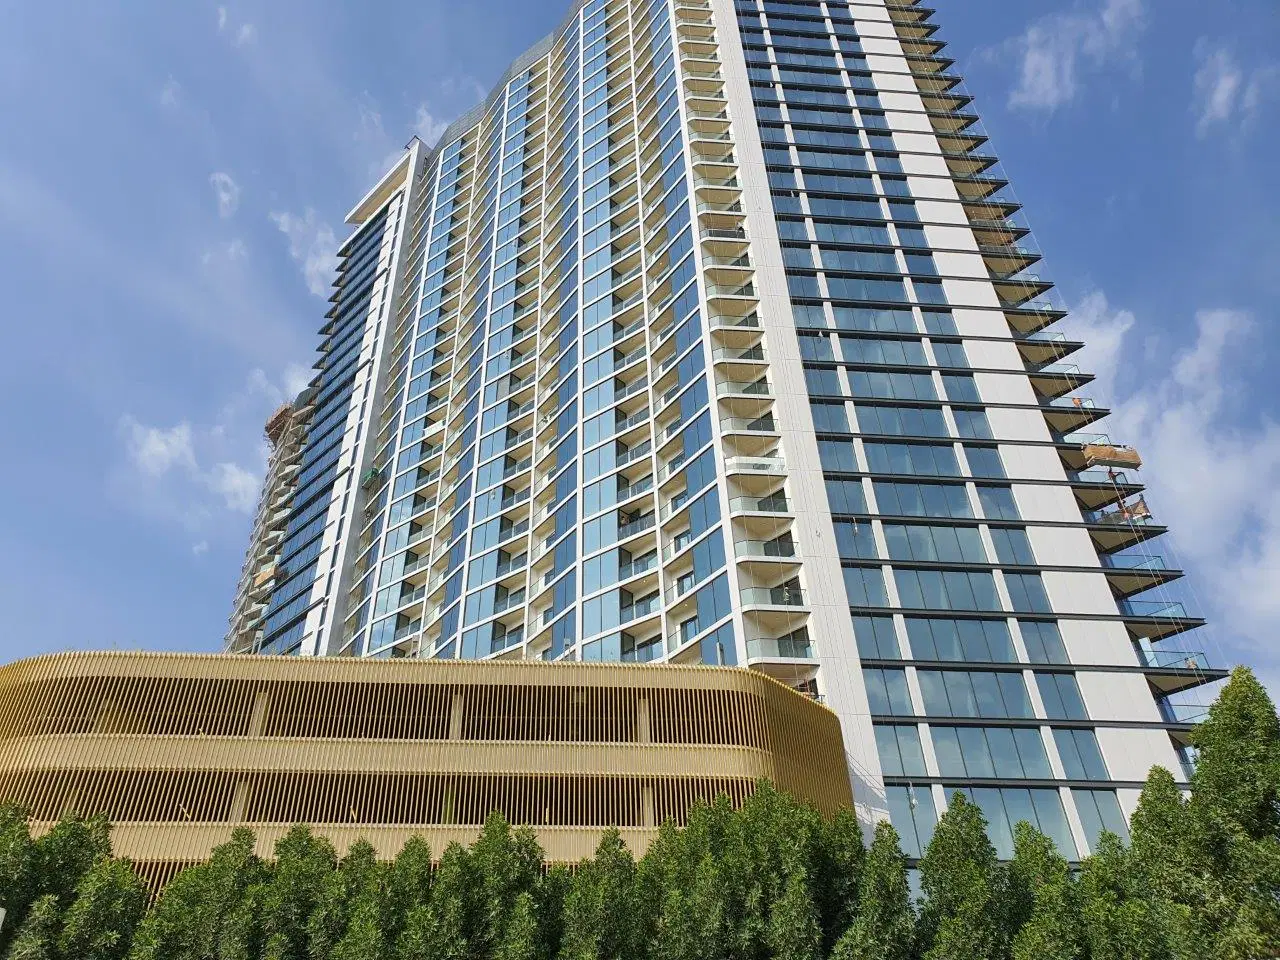
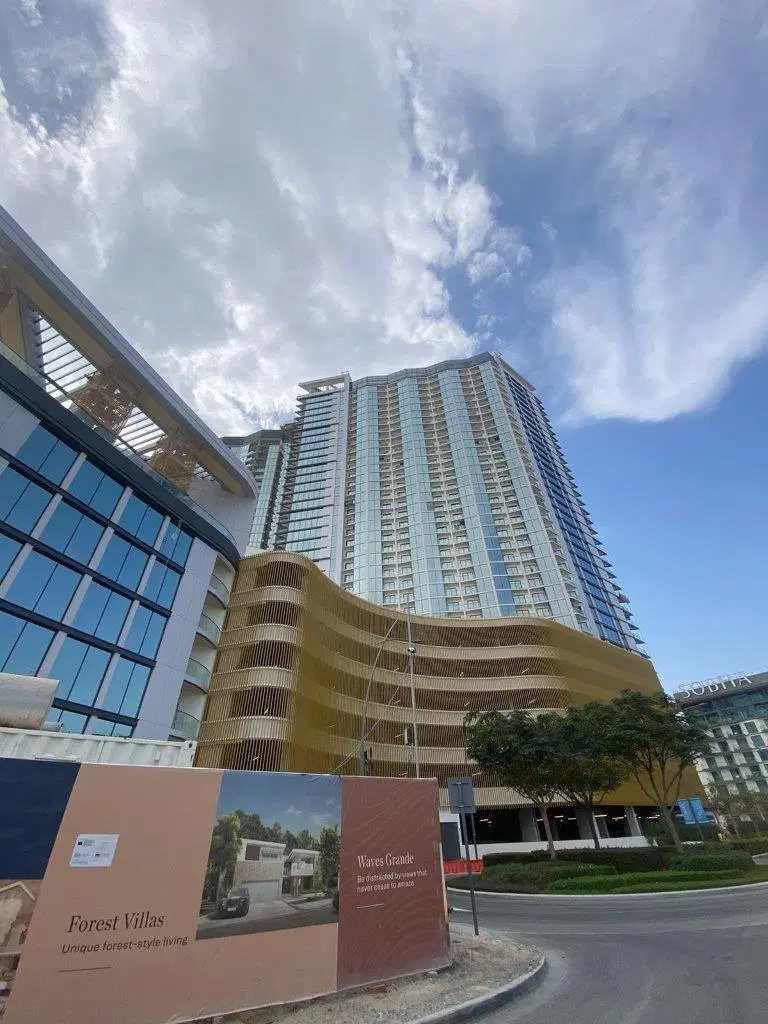
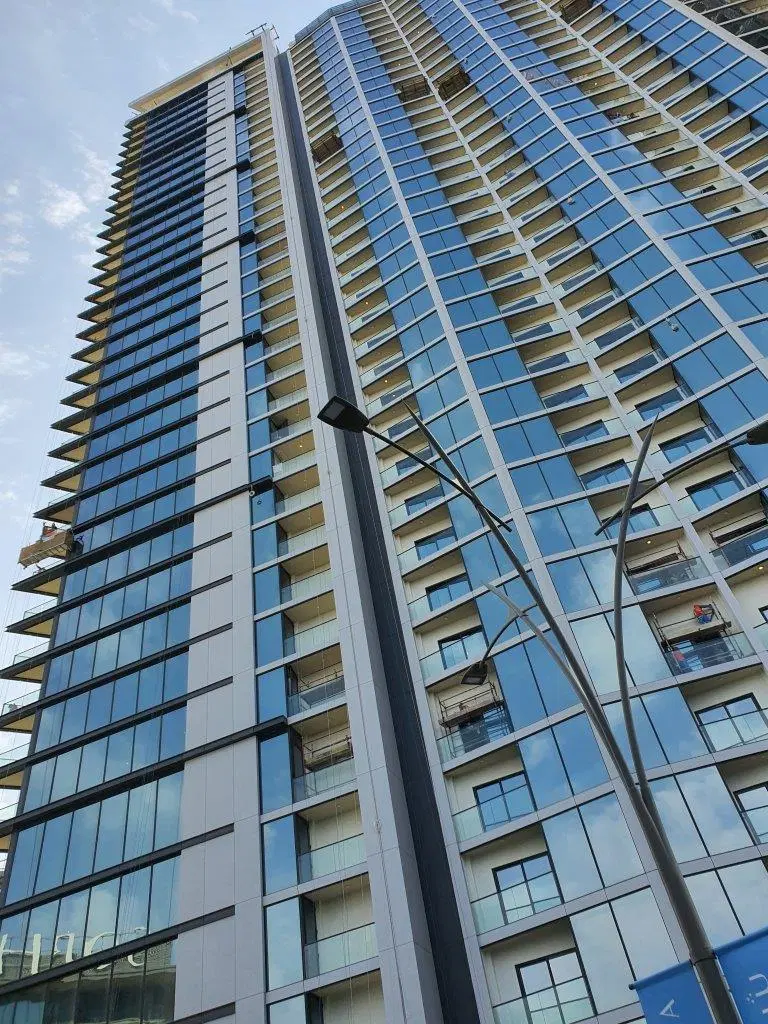
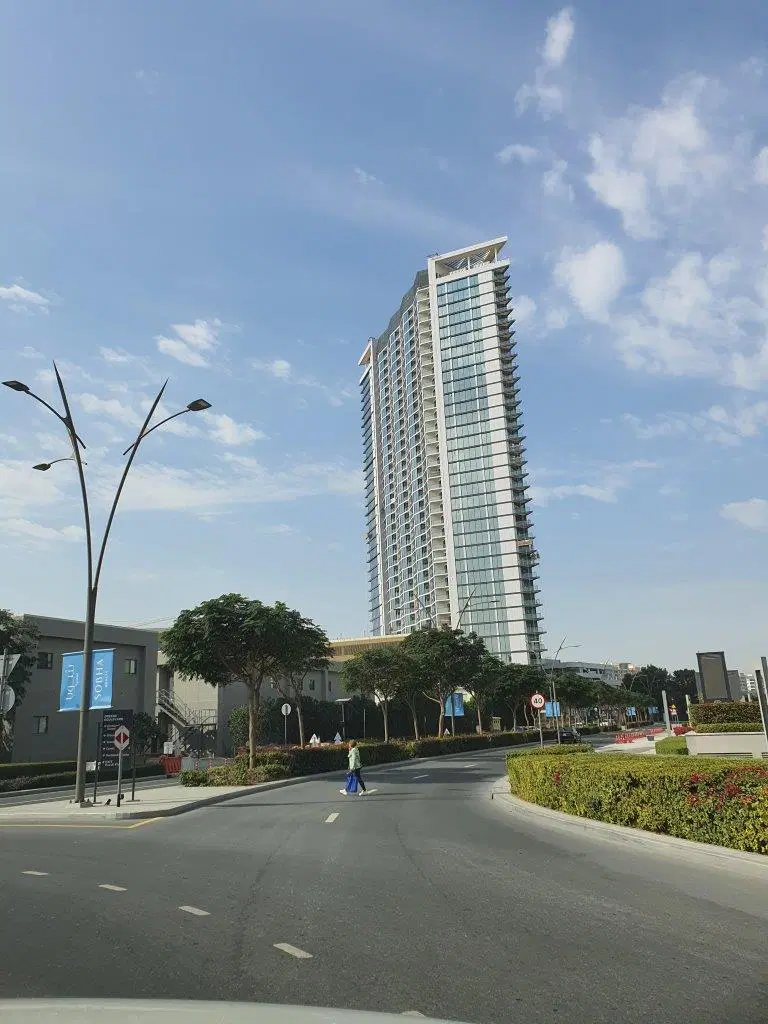
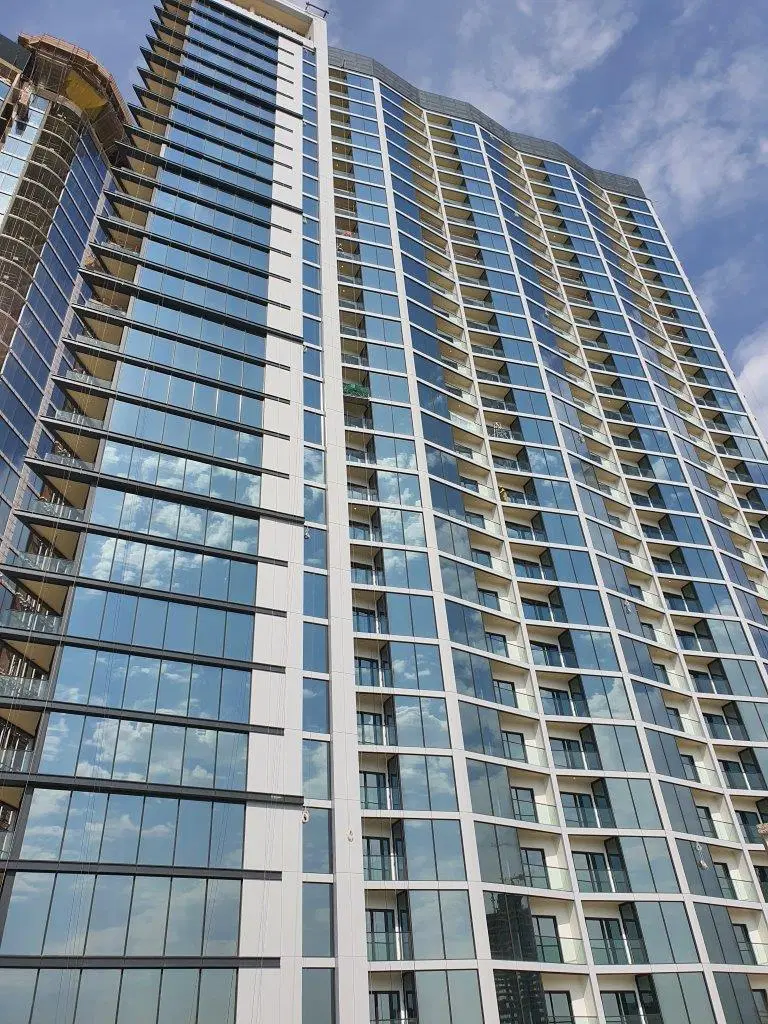
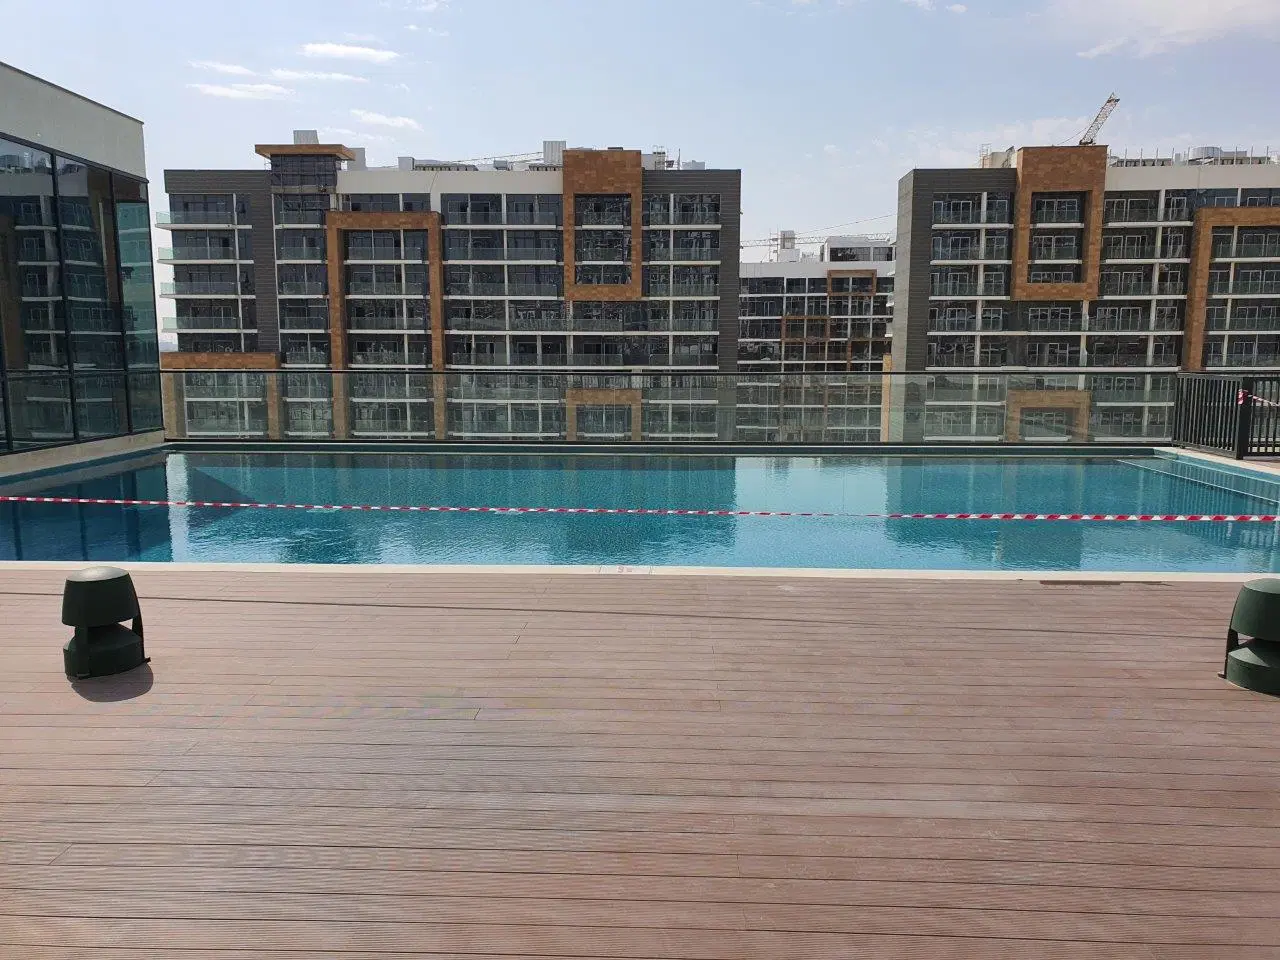
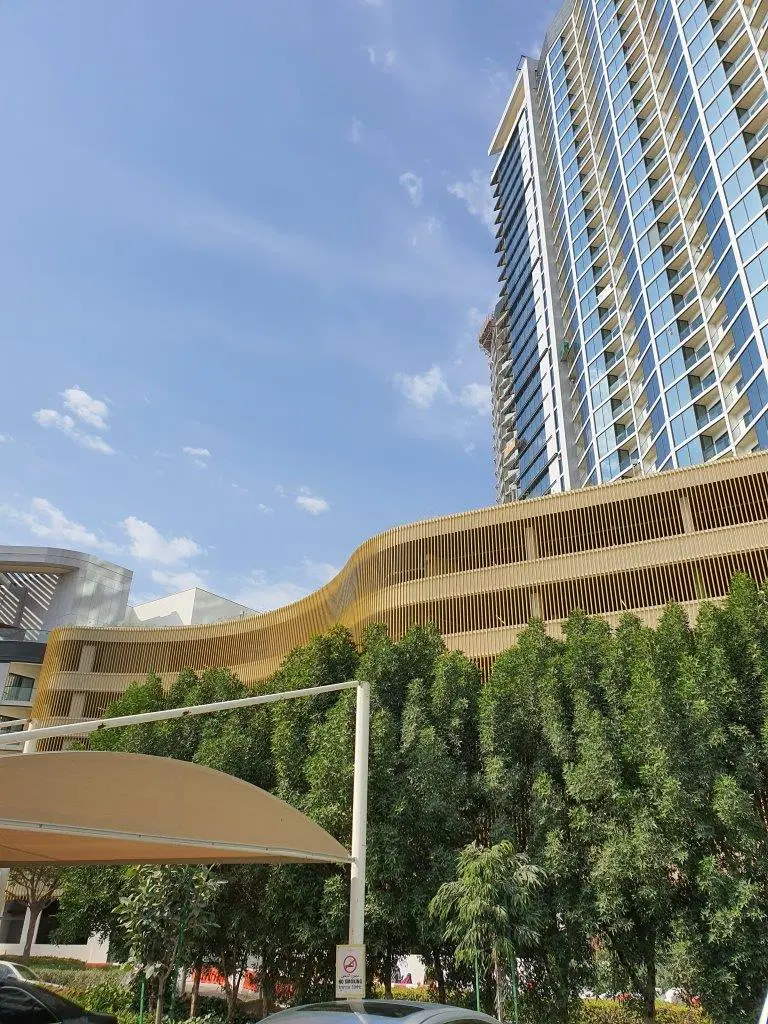
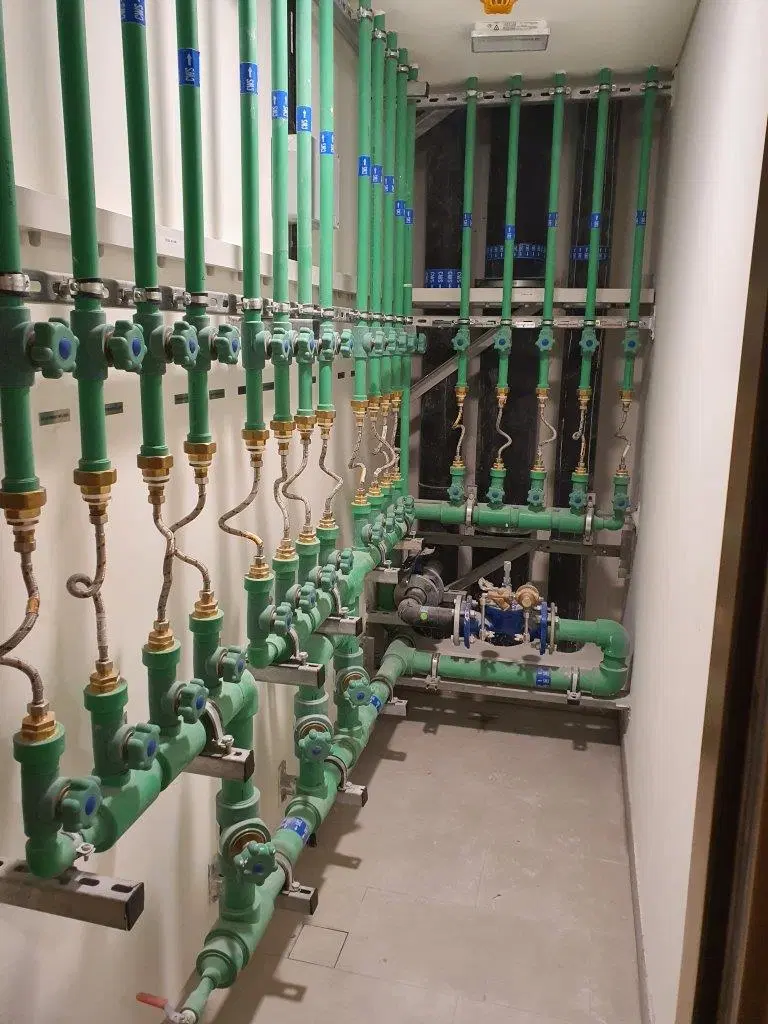
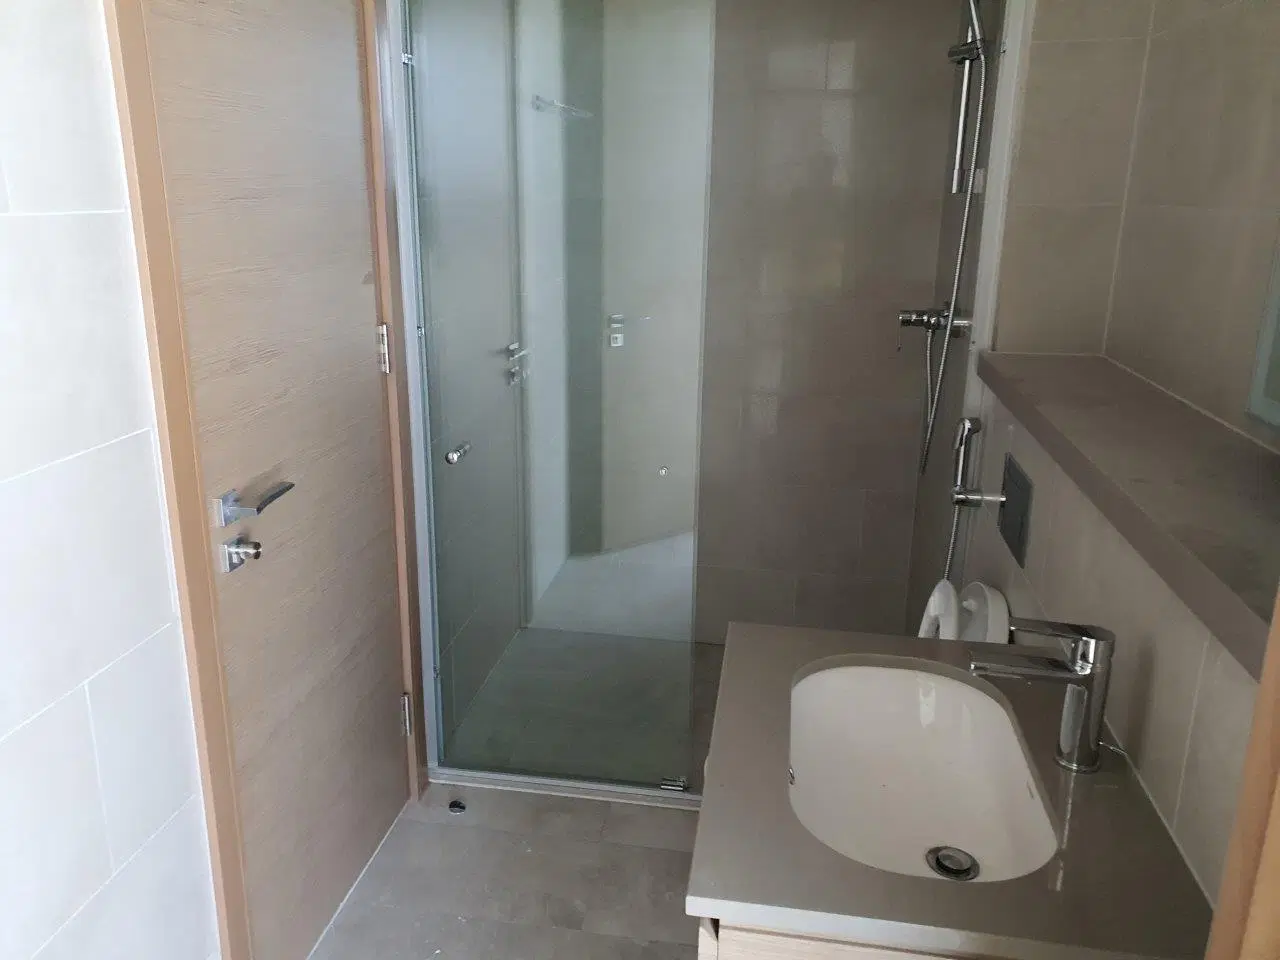
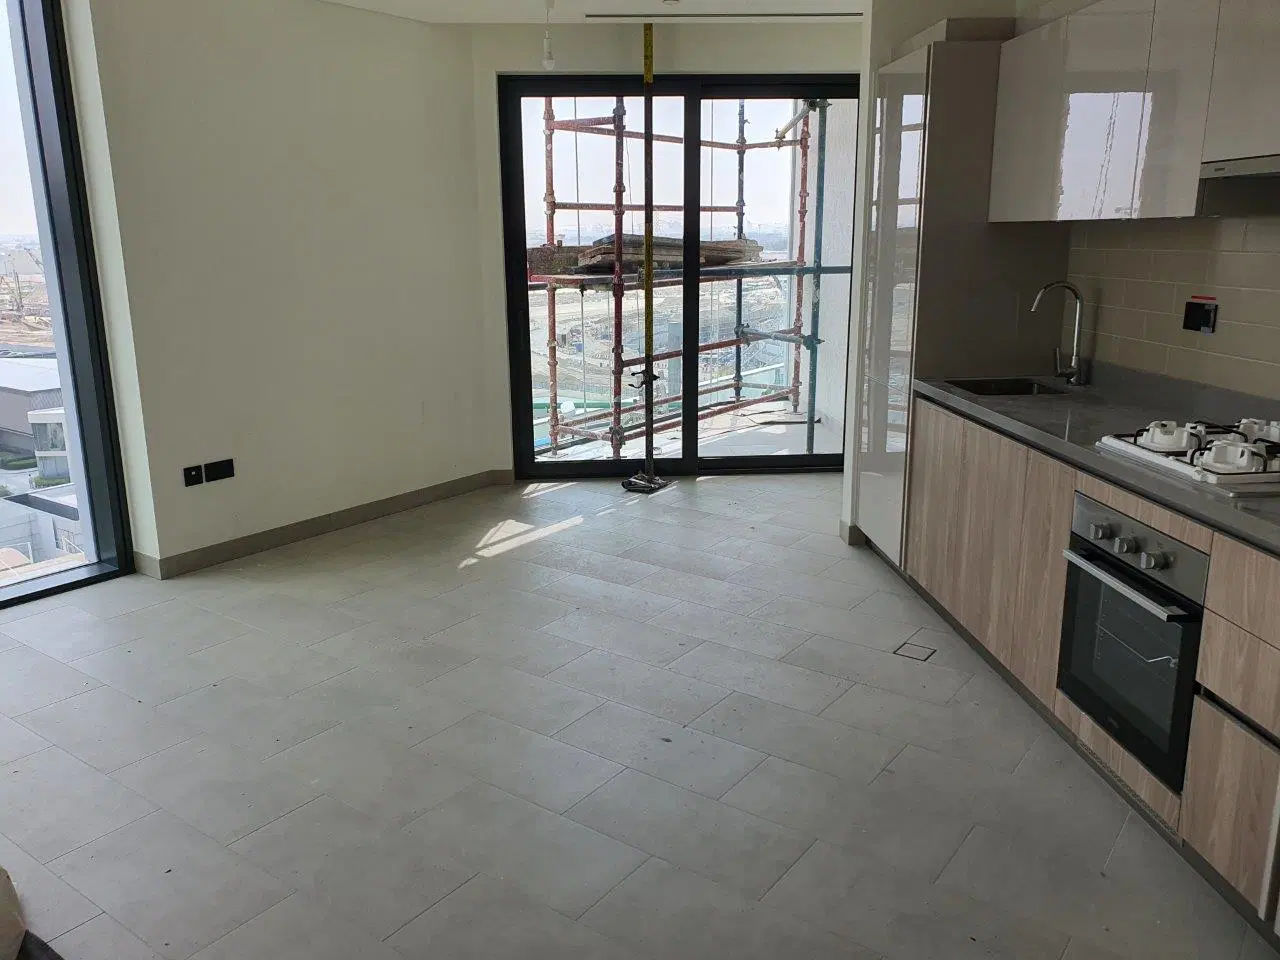
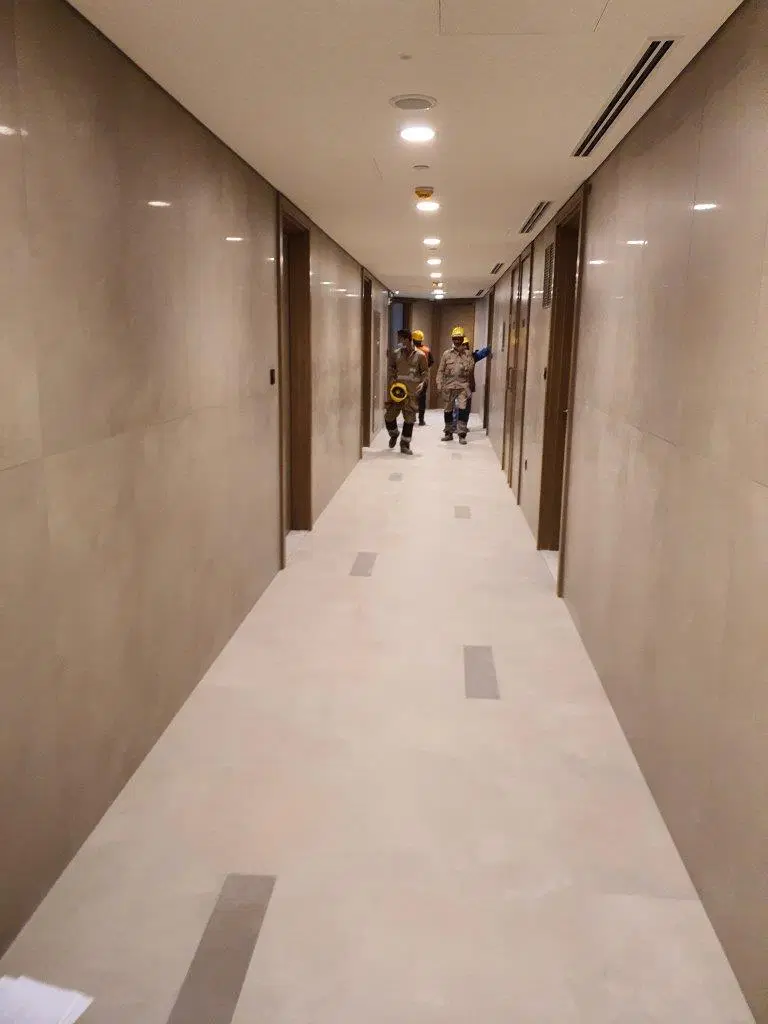
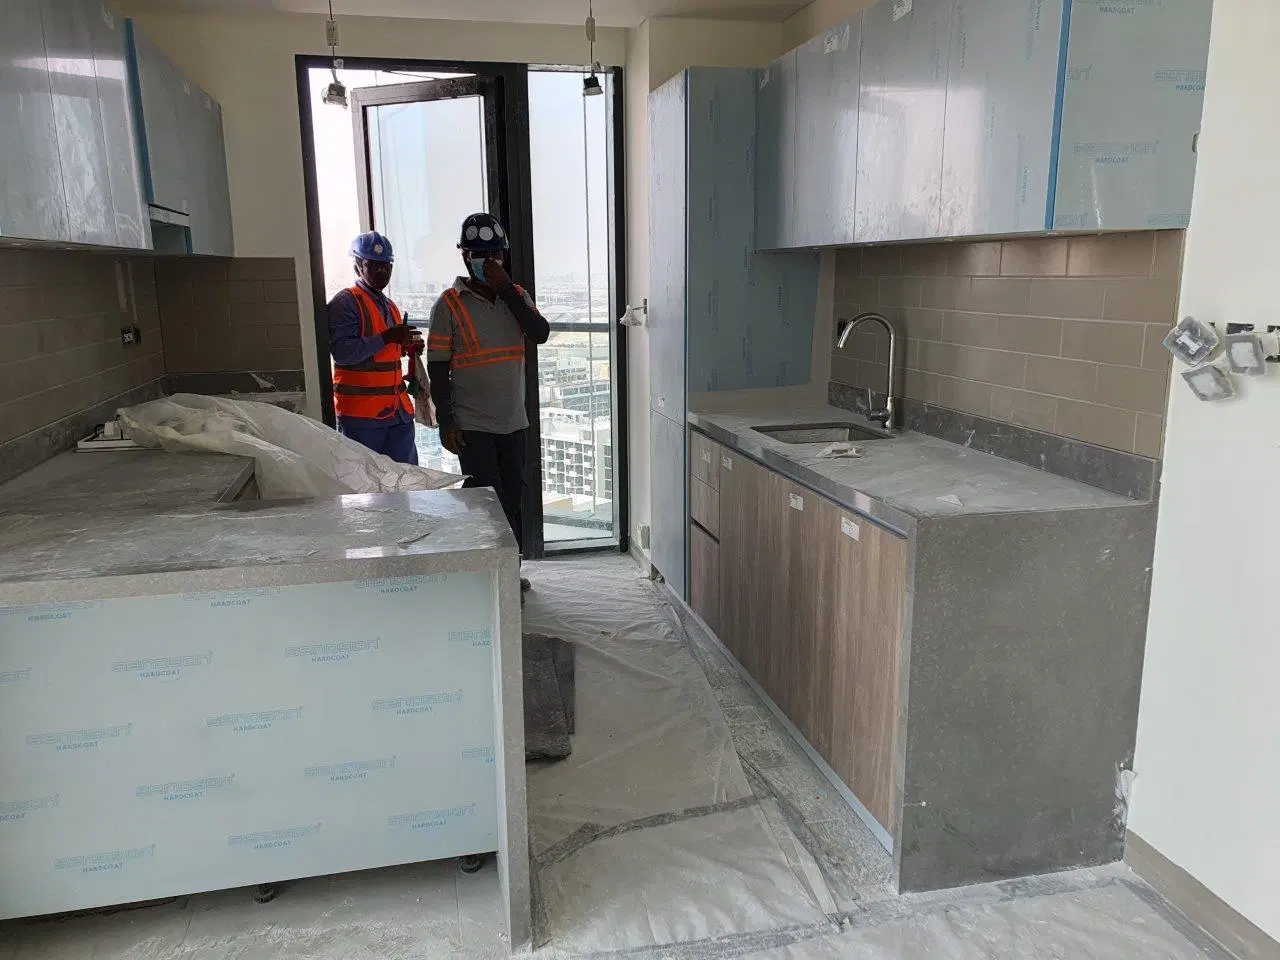
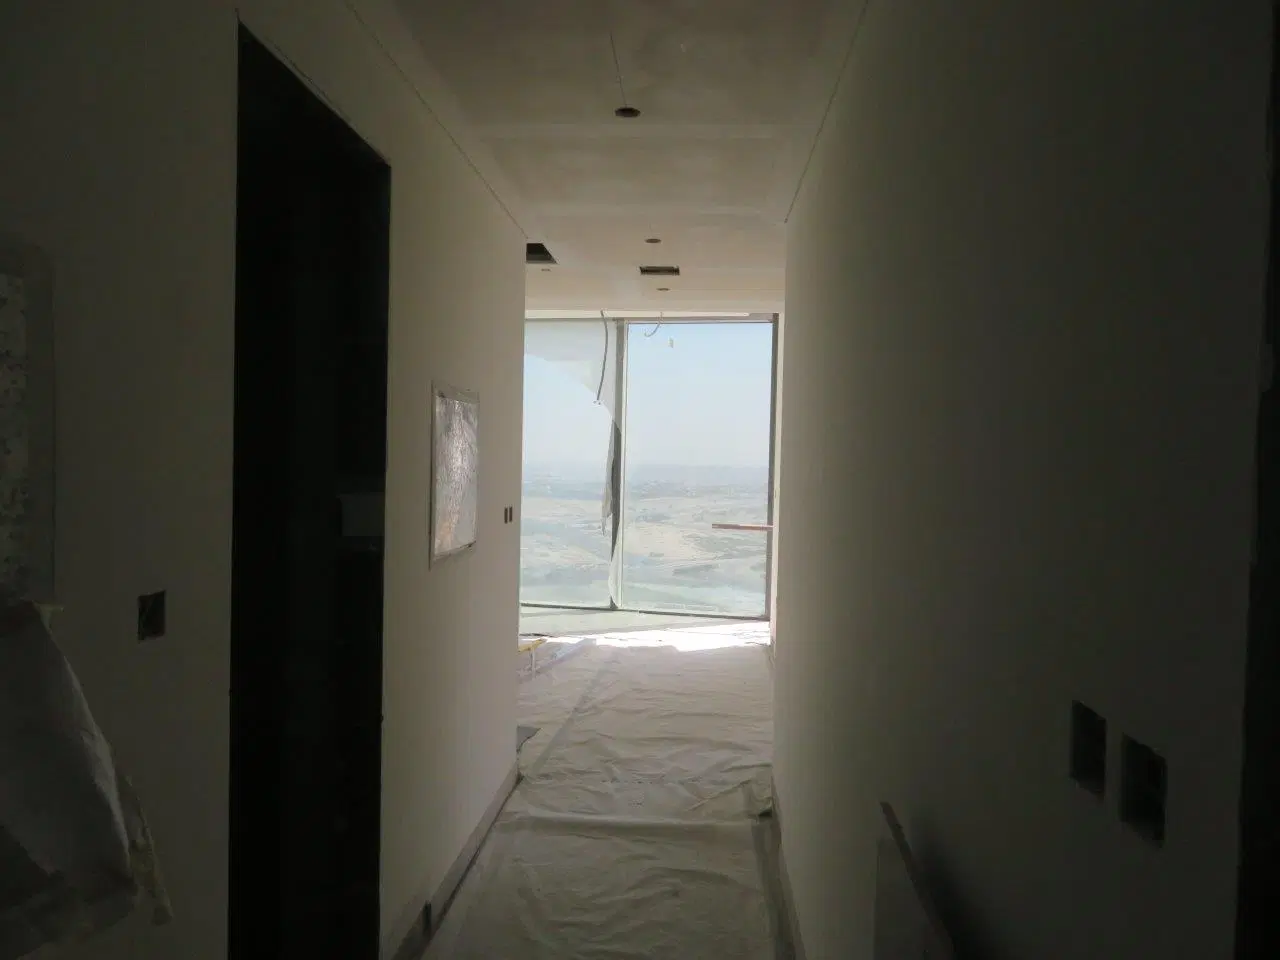
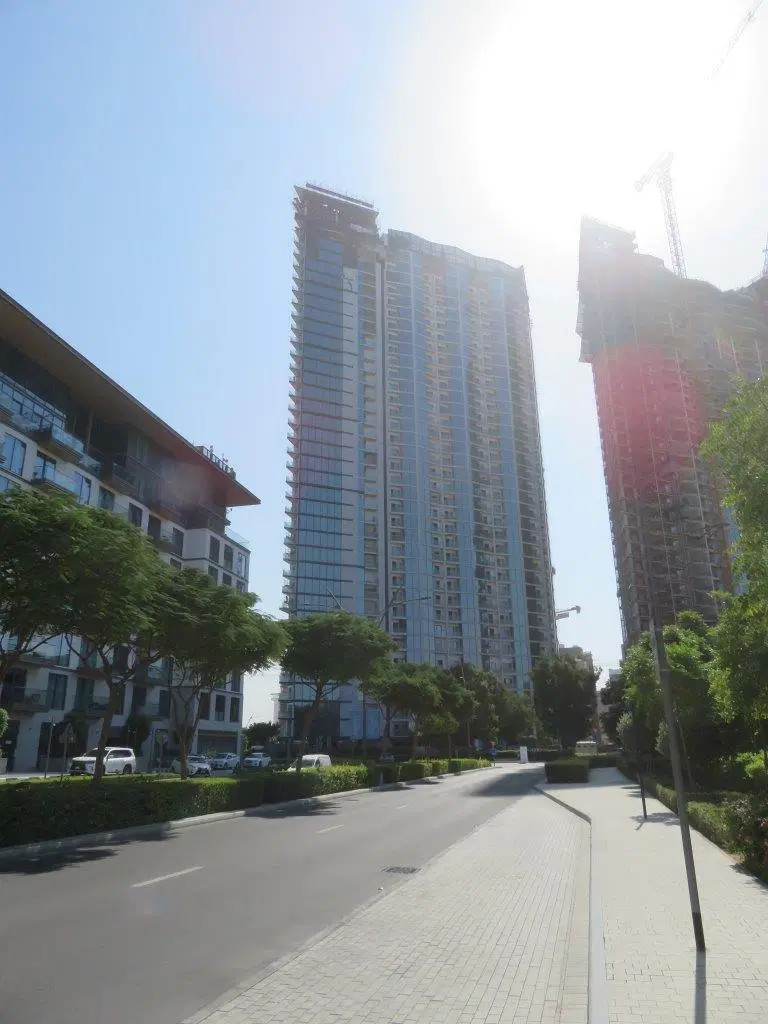
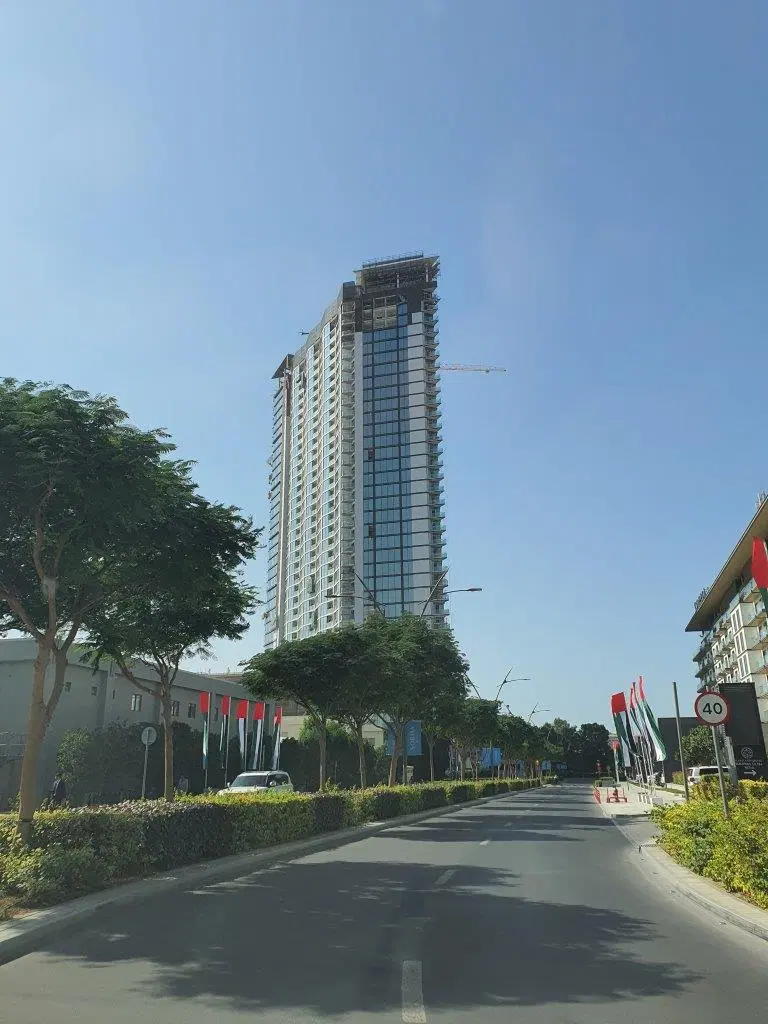
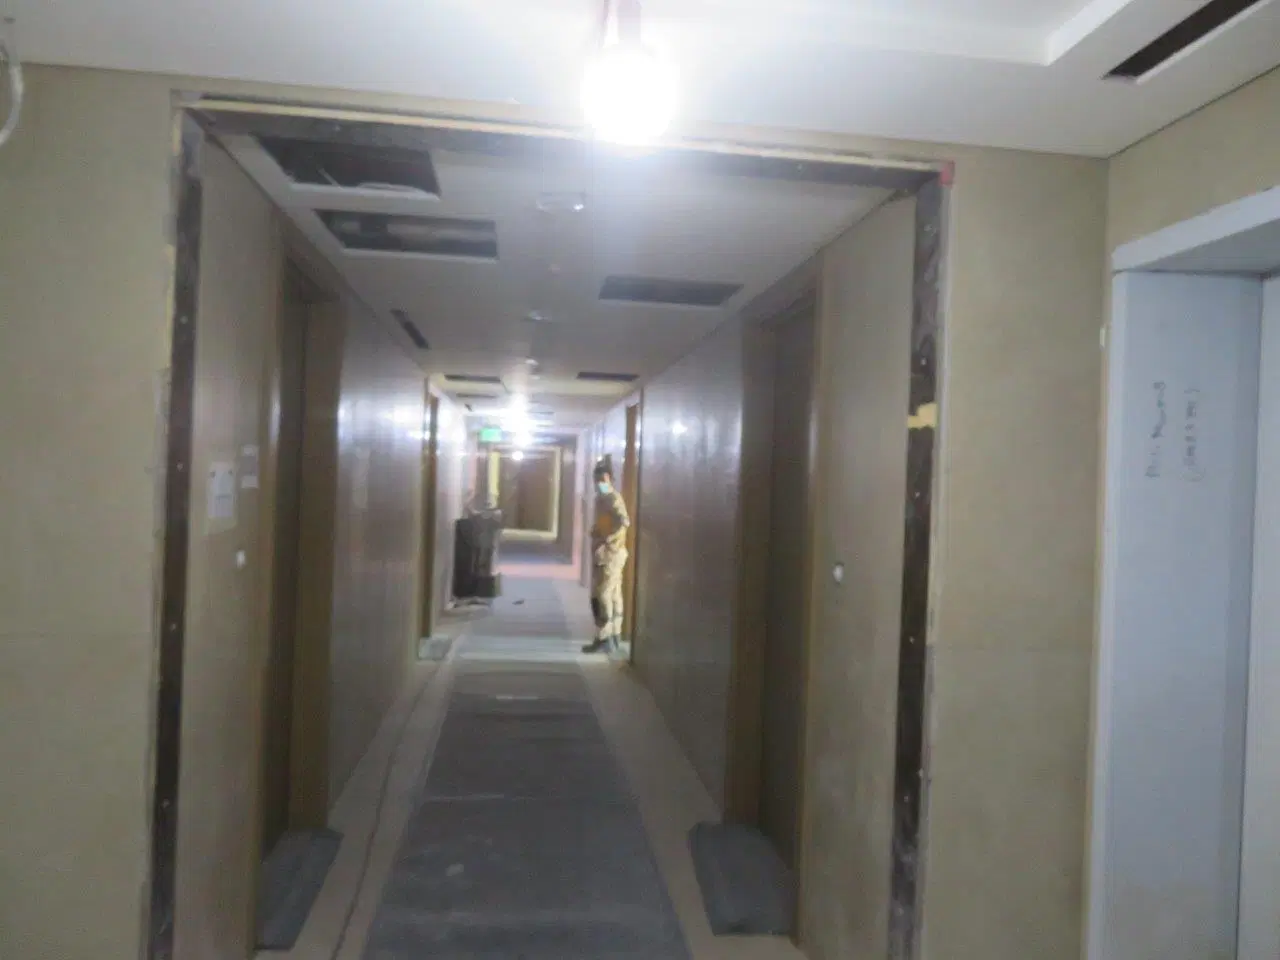
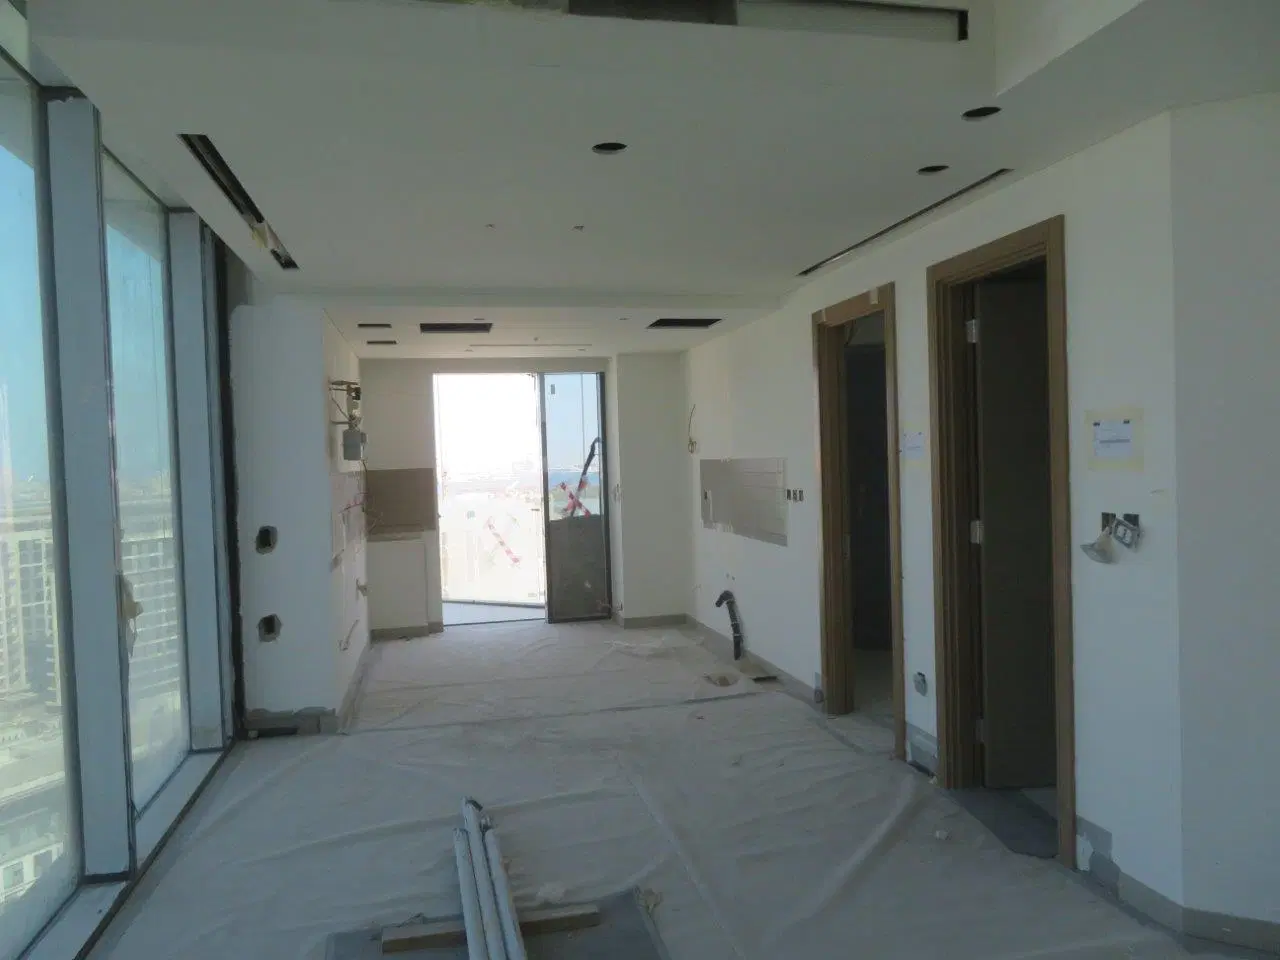
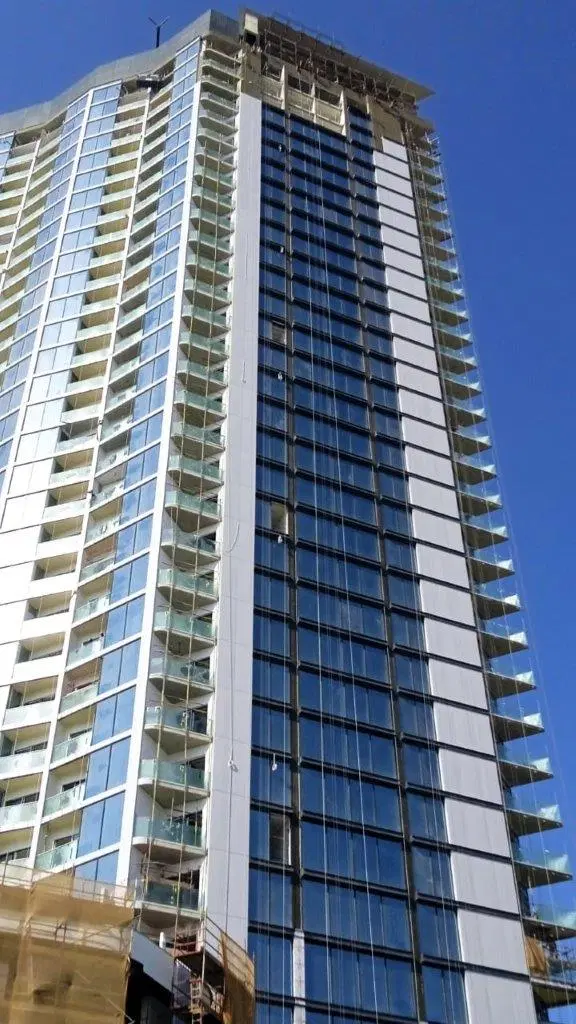
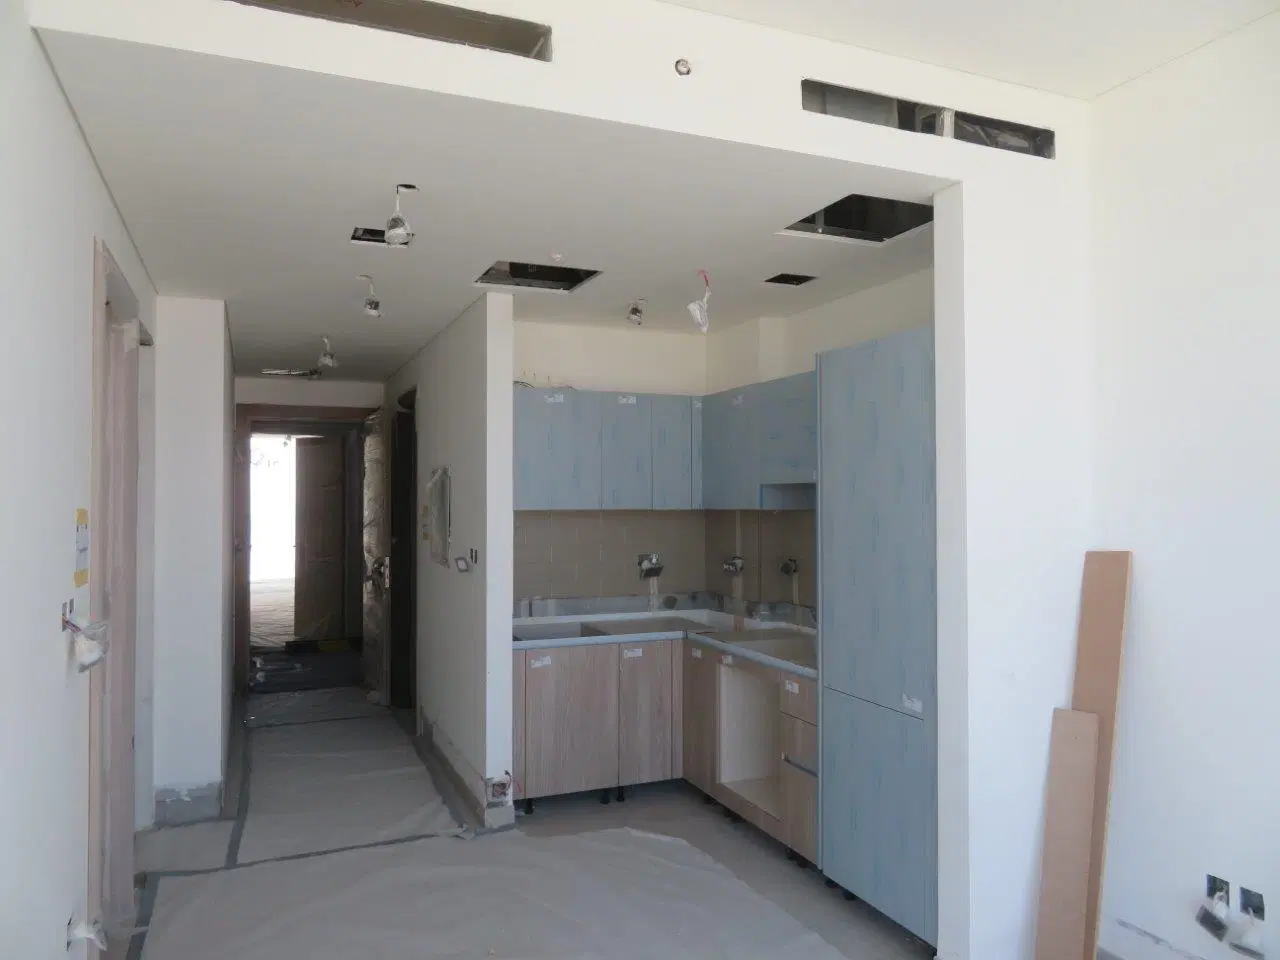
53 more photos in the DLD register
Construction photos are taken by the technical inspectors of the Dubai Land Department (DLD) and remain its property. We show compressed copies; full-resolution originals are available in the Real Estate Project Status service.
All Dubai construction in the DLD register · Developer: Sobha Group · District: Mohammed Bin Rashid City
| Date | Type | Size, m² | Price, AED |
|---|---|---|---|
| 07.10.2026 | 1 BR | 46.9 | 1 000 000 |
| 07.10.2026 | 2 BR | 80.9 | 1 260 000 |
| 07.10.2026 | 1 BR | 46.9 | 800 000 |
| 01.10.2026 | 207.2 | 5 400 000 | |
| 28.09.2026 | 1 BR | 47.8 | 1 050 000 |
| 28.09.2026 | 1 BR | 47.8 | 840 000 |
| 25.09.2026 | 2 BR | 111.8 | 2 300 000 |
| 25.09.2026 | 2 BR | 111.8 | 1 840 000 |
| 21.09.2026 | 1 BR | 58.1 | 1 380 000 |
| 21.09.2026 | 1 BR | 58.1 | 1 104 000 |
| 11.09.2026 | 1 BR | 46.6 | 1 100 000 |
| 10.09.2026 | 1 BR | 46.9 | 1 100 000 |
| 10.09.2026 | 1 BR | 46.9 | 880 000 |
| 08.09.2026 | 2 BR | 79.9 | 1 719 640 |
| 07.09.2026 | 1 BR | 47.9 | 994 000 |
| 07.09.2026 | 1 BR | 47.9 | 1 180 000 |
| 31.08.2026 | 47.8 | 1 665 000 | |
| 27.08.2026 | 1 BR | 46.9 | 1 100 000 |
| 10.08.2026 | 1 BR | 47.9 | 14 847 |
| 03.08.2026 | 1 BR | 47.9 | 980 000 |
| 03.08.2026 | 2 BR | 103.9 | 1 290 000 |
| 03.08.2026 | 2 BR | 103.9 | 2 150 000 |
| 30.07.2026 | 1 BR | 48.8 | 8 722 |
| 28.07.2026 | 1 BR | 46.9 | 46 724 |
| 21.07.2026 | 2 BR | 111.8 | 2 155 299 |
| 20.07.2026 | 2 BR | 103.9 | 1 410 000 |
| 16.07.2026 | 2 BR | 111.5 | 2 500 000 |
| 13.07.2026 | 1 BR | 47.8 | 788 477 |
| 03.07.2026 | 1 BR | 47.9 | 1 017 600 |
| 26.06.2026 | 1 BR | 58.1 | 1 380 000 |
| 26.06.2026 | 1 BR | 58.1 | 1 035 000 |
| 24.06.2026 | 1 BR | 24.4 | 548 259 |
| 12.06.2026 | 2 BR | 111.8 | 2 200 000 |
| 11.05.2026 | 2 BR | 79.0 | 1 087 000 |
| 06.05.2026 | 1 BR | 48.8 | 984 000 |
| 06.05.2026 | 1 BR | 48.8 | 1 230 000 |
| 24.04.2026 | 2 BR | 103.9 | 2 100 000 |
| 24.04.2026 | 2 BR | 103.9 | 1 320 000 |
| 17.04.2026 | 2 BR | 79.0 | 791 375 |
| 08.04.2026 | 1 BR | 58.1 | 1 144 800 |
| 31.03.2026 | 2 BR | 79.0 | 1 952 000 |
| 17.03.2026 | 59.0 | 3 629 350 | |
| 11.03.2026 | 2 BR | 111.7 | 1 960 000 |
| 10.03.2026 | 1 BR | 59.7 | 700 434 |
| 04.03.2026 | 1 BR | 57.0 | 1 120 000 |
| 10.02.2026 | 1 BR | 47.5 | 2 000 000 |
| 10.02.2026 | 1 BR | 47.8 | 976 000 |
| 10.02.2026 | 1 BR | 46.6 | 2 000 000 |
| 10.02.2026 | 1 BR | 47.8 | 1 220 000 |
| 09.02.2026 | 1 BR | 47.8 | 1 160 000 |
| Date | Type | Size, m² | Rent, AED/yr |
|---|---|---|---|
| 10.10.2026 | 1bed room+Hall | 47.8 | 70 000 |
| 10.10.2026 | 1bed room+Hall | 59.8 | 83 000 |
| 10.10.2026 | 1bed room+Hall | 46.9 | 67 000 |
| 09.10.2026 | 1bed room+Hall | 47.9 | 78 000 |
| 09.10.2026 | 1bed room+Hall | 58.1 | 80 000 |
| 08.10.2026 | 2 bed rooms+hall | 81.0 | 120 000 |
| 05.10.2026 | 2 bed rooms+hall | 79.0 | 104 000 |
| 04.10.2026 | 1bed room+Hall | 47.8 | 70 000 |
| 03.10.2026 | 1bed room+Hall | 59.0 | 75 000 |
| 02.10.2026 | 1bed room+Hall | 47.9 | 75 000 |
| 02.10.2026 | 1bed room+Hall | 57.6 | 85 000 |
| 02.10.2026 | 2 bed rooms+hall | 82.1 | 100 000 |
| 01.10.2026 | 2 bed rooms+hall | 80.9 | 110 000 |
| 01.10.2026 | 1bed room+Hall | 46.6 | 72 000 |
| 01.10.2026 | 1bed room+Hall | 57.6 | 82 000 |
| 01.10.2026 | 2 bed rooms+hall | 79.0 | 125 000 |
| 01.10.2026 | 1bed room+Hall | 46.9 | 71 400 |
| 30.09.2026 | 1bed room+Hall | 47.8 | 75 000 |
| 29.09.2026 | 2 bed rooms+hall | 81.8 | 100 000 |
| 28.09.2026 | 2 bed rooms+hall | 79.0 | 120 000 |
Dubai Land Department transaction registry, updated 10.10.2026. Explore Dubai property transactions →
Dubai Land Department records for this building: closed transaction prices, not asking prices or estimates. Figures are medians, so a single expensive sale does not move them.
The yearly figure compares the last 12 months with the 12 before them: calendar years would not work, the current one is unfinished. The district moved +1% over the same period, so the building lagged.
| Type | Size, m² | Price, AED | Per m² | Deals |
|---|---|---|---|---|
| 1 bedroom | 48 | 1 144 471 | 23 843 | 659 |
| 2 bedrooms | 97 | 2 150 000 | 22 165 | 230 |
Median across all recorded deals in this building. Rows with fewer than five deals are omitted: there is nothing to average there.
From 2022 to 2025 — +18% on the price per square metre in this building. The district moved +16% over the same period, so the building tracked the market.
Top to bottom: purchase price per m², year, annual rent per m², gross yield.
All figures are medians. Years with fewer than eight deals are skipped; rent is shown where there are at least twenty contracts. The yield is gross — service charges are not published in the register.
* 2026 is still in progress and its bar covers part of the year. The growth figure above uses completed years.
Source: Dubai Land Department transaction register. The register is updated daily; the figures here are recalculated weekly.
DLD has recorded 904 sales in this building since 2021, 315 of them resales. We compare your unit with sales of the same layout here, not with asking prices. Free, reply within 24 hours.
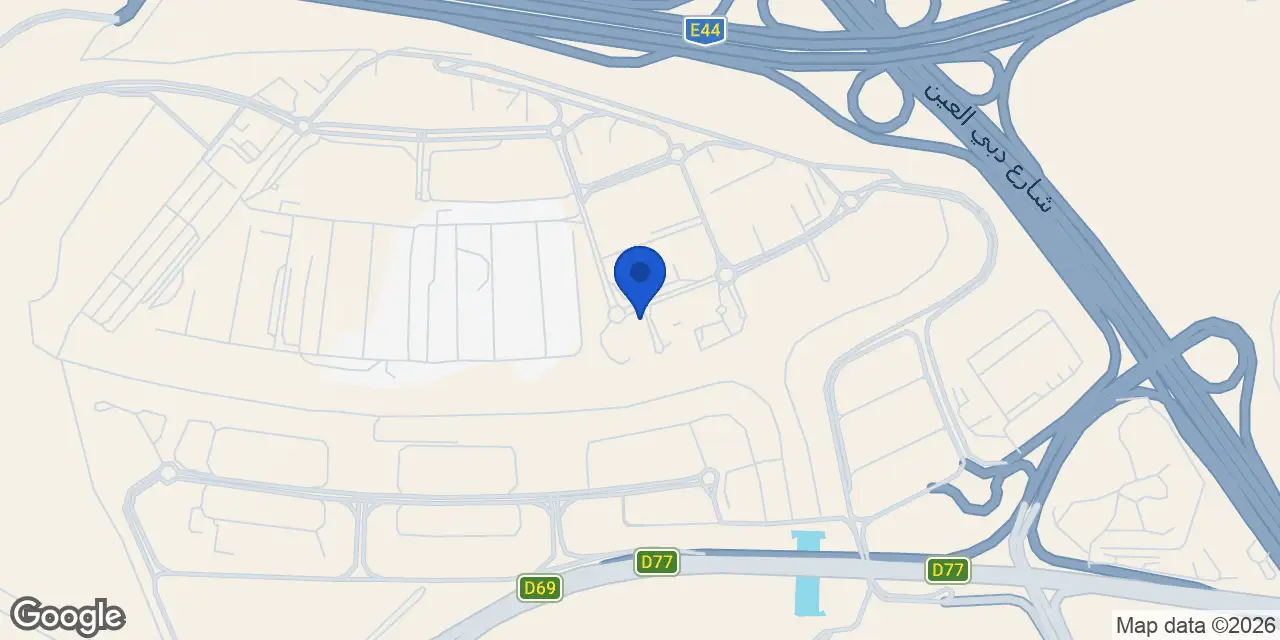
Sobha Hartland Waves is a completed residential building in Mohammed Bin Rashid City, Dubai. Over 2024–2025 the building recorded 176 resale transactions at an average of AED 23,873 per m² (average deal AED 1,501,159), per Dubai Land Department data. The tower has 39 floors.
This page tracks live DLD transactions for the building, current service charges and nearby infrastructure. For apartments currently available for sale or rent here, contact a Continental Club Property broker (RERA 31933) — reply usually within an hour.
Dubai market as a whole: prices, transactions and trends (DLD data) →
Managed by Sobha Community Management · budget 1 Jan 2026 — 31 Dec 2026
History, budget breakdown and nearby buildings →
RERA-approved budget from the DLD service charge index (Mollak) for “Sobha Hartland Waves”. Total is the general and reserve funds; additional charges are separate.
We will send floor plans, the payment plan and available units for this project.
Project data comes from the Dubai Land Department (DLD) registry.
Machine-readable mirrors of this page: Markdown · JSON. They carry the same figures as this page, each with its origin labelled.
How to cite:Sobha Hartland Waves — Continental Club Property, from Dubai Land Department registry and developer data, 2026-10-10, https://continentalclub.ae/project/sobha-hartland-waves-mohammed-bin-rashid-city/