Ritaj is a purpose-built residential enclave inside Dubai Investments Park (DIP). The development comprises a cluster of low-rise apartment blocks arranged as a gated community, offering compact apartment types and an on-site community centre. The complex was delivered by Dubai Investment Real Estate LLC and completed in the early 2010s.
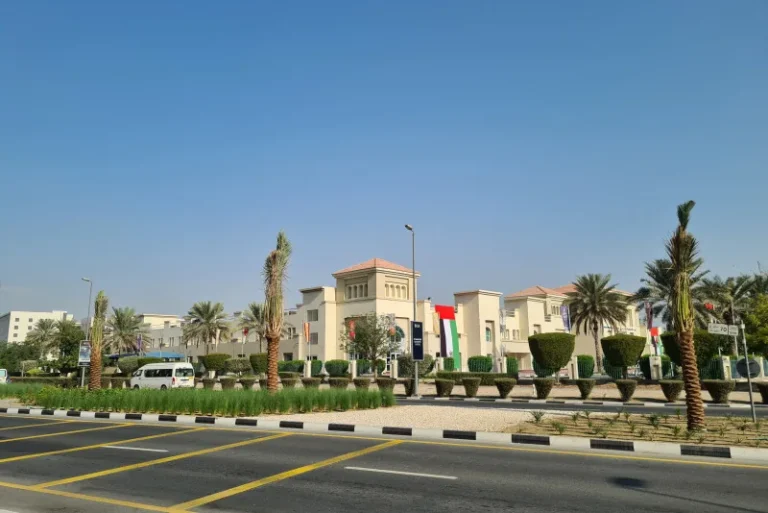
Ritaj occupies a position within Dubai Investments Park (DIP), a mixed-use zone in the southern sector of Dubai. The Ritaj complex consists of 11 six-storey residential buildings and contains a total of 2,024 homes. Unit mix is predominantly studios and one-bedroom apartments with additional two- and three-bedroom layouts: 1,343 studios, 447 one-bedroom, 194 two-bedroom and 40 three-bedroom units. The project was launched in October 2008, with handovers carried out between 2010 and 2012.
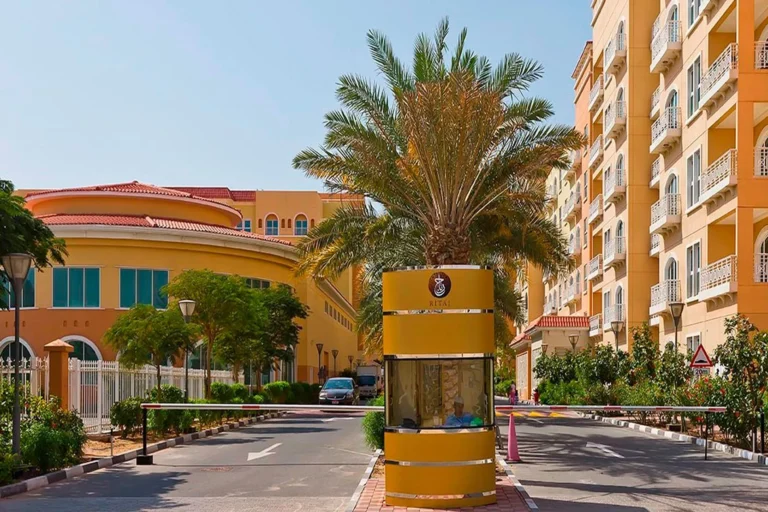
Ritaj is positioned for road access across south-west and central Dubai. The nearest metro reference is on the Red Line (station code R74), located about 4,982 metres from the development; this distance is not classified as walkable. By road the project is within moderate driving distance of major Dubai landmarks:
When traffic flows smoothly, Ritaj benefits from direct road links toward Jebel Ali Free Zone, Abu Dhabi and the Expo site. The location is oriented to car use and short local journeys rather than rapid metro commutes.
Ritaj is a gated estate made up of eleven six-storey blocks. The residential offer is heavy on compact units: studios and one-bedroom flats form the majority of the total 2,024 units. The development was implemented and handed over in the period 2010–2012.
On-site provisions and communal facilities include:
The arrangement prioritises self-contained, everyday convenience for residents, with essential retail and services grouped in the community centre. The estate’s low-rise form and internal landscaping are consistent with DIP’s broader mix of residential, commercial and light-industrial zones.
Ritaj sits within Dubai Investments Park’s wider urban fabric. The surrounding area combines workplace districts and residential communities serving employees and families linked to DIP and nearby industrial areas. Educational institutions noted nearby include The International School of Choueifat DIP (around 3.1 km) and Bright Riders School Dubai (around 3.2 km). The community’s proximity to Expo City Dubai (about 6.1 km) and Al Maktoum International Airport (about 11.1 km) shapes commuting patterns and destination choices for residents.
Market activity for Ritaj is recorded through Dubai Land Department transaction data; there are 50 sale transaction records available for the development in the public register.
Given its accommodation mix and on-site amenities, Ritaj is primarily suited to:
The development’s unit profile and the presence of multiple studios indicate a focus on shorter-stay households and tenants rather than larger-family requirements. Three-bedroom units are present but account for a small share of the housing stock.
How many homes are in Ritaj?
Ritaj contains 2,024 residential units across 11 six-storey buildings.
Who developed Ritaj and when was it completed?
The scheme was developed by Dubai Investment Real Estate LLC; it was launched in October 2008 and handovers occurred between 2010 and 2012.
What on-site facilities are available?
Each block has a swimming pool. The gated community also provides landscaped gardens, 24-hour security, maintenance and cleaning, and a community centre with restaurants, cafés, shops, a supermarket, a clinic, a pharmacy and a mosque.
How close is the metro and is it walkable?
The nearest Red Line reference is station code R74 at about 4,982 metres; this distance is not considered walkable, so residents typically rely on car or taxi for wider commutes.
For location mapping, transaction records and listing aggregation related to Ritaj, property portals and Dubai Land Department data provide daily-updated public records on sales and transfers (data updated on working days, excluding public holidays).
Machine-readable mirrors of this page: Markdown · JSON. Every field carries its origin.
How to cite:Ritaj — Continental Club Property, 2026-07-30, https://continentalclub.ae/location/ritaj/
The figures below come from registered Dubai Land Department transactions, not from listings. We show the median rather than the mean, so that one-off penthouses do not distort it.
The yearly figure compares the last 12 months with the 12 before them. Calendar years would not work here: the current one is unfinished, so the comparison would understate the change.
From 2022 to 2025 — +37% on the price per square metre across 2 buildings that traded in both years.
For comparison: the median across the whole district moved +57%. The gap between the two figures is not existing homes appreciating — it is newer, more expensive buildings entering the market. Returns on a purchase follow the first figure.
Top to bottom: purchase price per m², year, annual rent per m², gross yield. Showing the last 13 years, from 2014.
* 2026 is still in progress, so its bar covers part of the year and is not directly comparable with the ones before it. The growth figure below uses completed years only.
All figures are medians rather than means: in thin years the mean swings with the mix of units and shows movement the market never had. The yield is gross — service charges are not published in the register, so they cannot be deducted honestly.
| Building | Deals | Price per m² |
|---|---|---|
| RITAJ A | 109 | 9 162 |
| RITAJ F | 90 | 7 098 |
| RITAJ E | 74 | 6 996 |
| RITAJ G | 42 | 6 241 |
| RITAJ H | 28 | 6 543 |
Source: Dubai Land Department transaction registry. Prices per square metre, sale transactions.
Dubai market as a whole: prices, transactions and trends (DLD data) →
Largest management companies in the area: Al Mujama Real Estate (L L C) (13), Kingfield Owner Association Management Services (7), Highrise Owners Association Management Services (1).
Check any building’s service charge → All communities
RERA-approved 2026 budgets from the DLD service charge index (Mollak); residential buildings. Rate is AED per sq ft per year; YoY compares the same buildings in 2025.


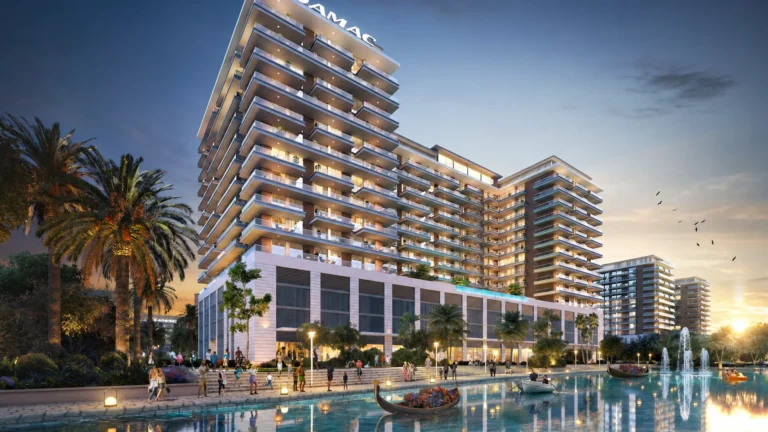

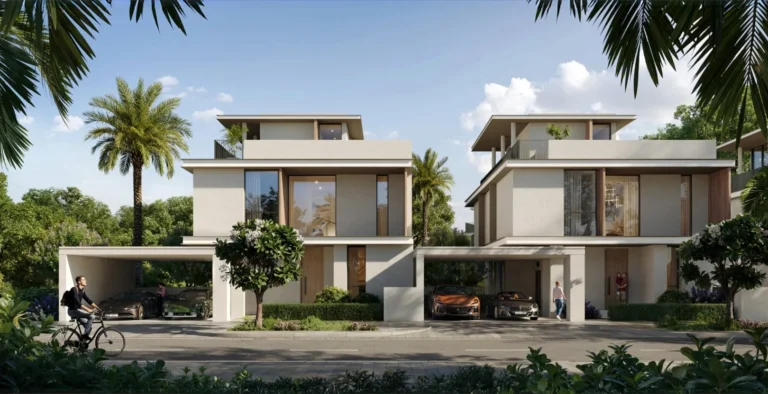
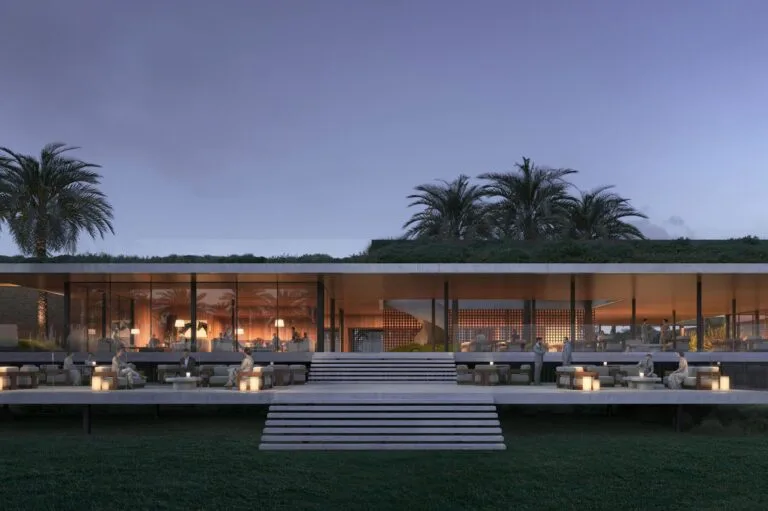


Neighbouring areas and sub-communities to compare location and prices.
 Dubai Investments Park 2
 Damac RiversideDubai Investments Park 2
 Dunes VillageDubai Investments Park 2
 Grand Polo Club and ResortDubai Investments Park 2Dubai Lagoon WinterberryDubai LagoonAva Designer ResidencesDubai LagoonDubai Lagoon I Suites Smart ResidencesDubai LagoonDubai Lagoon LilyDubai Lagoon