Updated: 22 January 20265 min read
1. Definition of the area and data structure
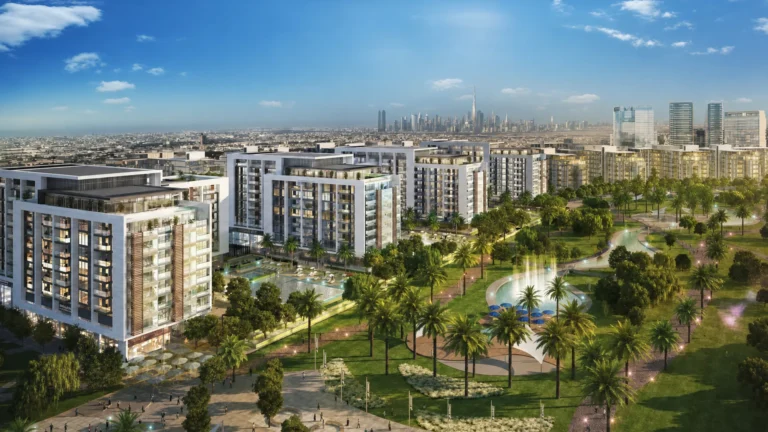
Actual location: the OASIS HIGH PARK building is located in the Nadd Hessa area, within the Silicon Oasis master project, as confirmed by DLD (Dubai Land Department) data. The building and project names fully match the query filter.
The DLD database records 101 transactions for this building. For rentals, there are at least 435 active contracts with correct unit sizes and rental rates for the OASIS HIGH PARK project (only studios were considered, filtered by the actual property type).
2. Dynamics of transactions, prices and rents for the building and the area
Liquidity and transaction volume
Transactions in OASIS HIGH PARK have been recorded consistently over the past 3–4 years, with peak activity in 2022–2023 (especially in the third quarters), averaging 4–11 deals per quarter. This reflects strong interest in this type of asset and the dynamic development of the area.
Average price per m² dynamics (studios)
• For OASIS HIGH PARK, the average price per m² ranged from 5,900 to 10,200 AED/m² between 2021 and 2025 (data for future 2025 transactions are not included in the investor-focused analysis). Over the last 12 months, the average achieved price for studios was 10,167 AED/m² (actual sales).
• For comparison, in Nadd Hessa the average price per m² for studios over the same period was 17,563 AED/m². The area as a whole is significantly more expensive than this particular building.
• Historically, prices in the area have shown steady growth, while in OASIS HIGH PARK the trend is moderately positive with some volatility in recent quarters.
Rental dynamics (annual rent per m², studios only)
• In OASIS HIGH PARK, the average rental rate for studios over the last 12 months was 936 AED/m²/year.
• In Nadd Hessa, the comparable rental rate was 981 AED/m²/year.
• The rental market is consistently active, and the average rate in the building is only slightly below the area level (less than a 5% difference), indicating stable demand and liquidity.
Long-term rental trends (studios)
• Over the past 3–4 years, rental rates in the building have grown confidently: from 510–660 AED/m² in 2020–2021 to over 800–900 AED/m² in 2024 and above 900 AED/m² in the most recent quarters.
• The area shows a similar trajectory, even slightly smoother, but the overall direction is the same — steady rental growth driven by tenant demand.
3. Price and yield (ROI) comparison, fair range for an investor
Market price and rent over the last 12 months:
• OASIS HIGH PARK (studios): purchase price — 10,167 AED/m², rent — 936 AED/m²/year.
• Nadd Hessa (studios): price — 17,563 AED/m², rent — 981 AED/m²/year.
• The current price level in the building is significantly below the area average (a discount of ≈42%), which creates a competitive advantage for this particular asset in terms of “entry cost”.
Gross ROI:
• Building: ≈9.2% per annum (936 / 10,167)
• Area: ≈5.6% per annum (981 / 17,563)
Net ROI (including ≈7% transaction costs):
• Building: about 8.6% per annum (936 / (10,167 * 1.07))
• Area: about 5.2% per annum (981 / (17,563 * 1.07))
Fair price range for an investor targeting 7–8% annual yield:
• Building: the fair price range for an investor is 11,700–13,300 AED/m² (the current actual price is even below the lower bound, making the asset attractive for an investment entry).
• Area: the “investment fair” range is 12,300–14,000 AED/m², which is almost 30% below the current area average; to achieve a 7–8% rental yield, entry into the area as a whole is only feasible with a substantial discount.
4. Overall conclusion on liquidity and outlook
OASIS HIGH PARK stands out for:
• high liquidity in terms of the number of transactions and contracts;
• rental levels comparable to the wider area;
• a significantly lower entry price compared both to the area and even to the Silicon Oasis master project;
• one of the highest actual ROIs on studios over the last 12 months.
The asset suits investors focused on fast payback, tangible rental returns and a lower entry threshold in a rapidly developing area. Capital appreciation potential is constrained by the overall dynamics of the area; however, due to the current “lag” in the building’s pricing, there is room for moderate positive revaluation over a 2–3 year horizon as the area continues to grow.
5. Data quality and limitations
All key indicators have been validated against the DLD database. The sales and rental data for studios used in the analysis strictly reflect direct transactions and lease contracts, of which there are sufficient numbers in both the building and the area for robust statistics. All values are averaged; yields and ranges are not a guarantee of future performance, but only reflect the current actual state of the market.
Related Articles
- How to buy a home in Dubai in Elitz By Danube – analysis 2025
- ROI analysis of apartment in Creek Palace: DLD data and real deals
- How to sell a property in Dubai in The Sterling East – analysis 2025 — 22.01.2026
- ROI analysis of apartment in Binghatti Phantom: DLD data and real deals
- Complete Guide to DEWA for Dubai Property Tenants, Owners, and Investors