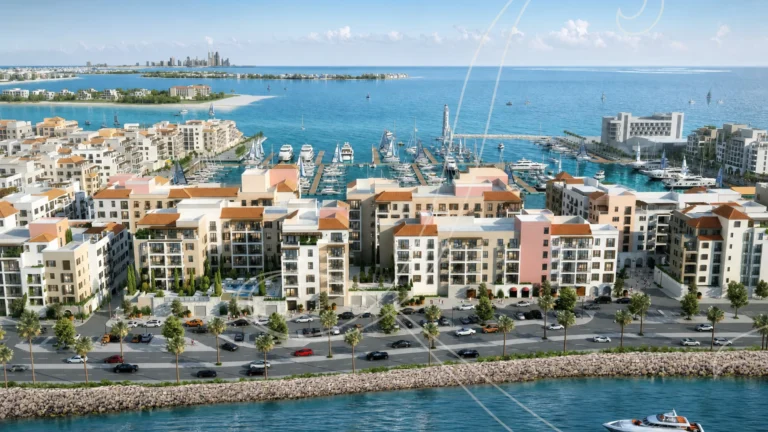
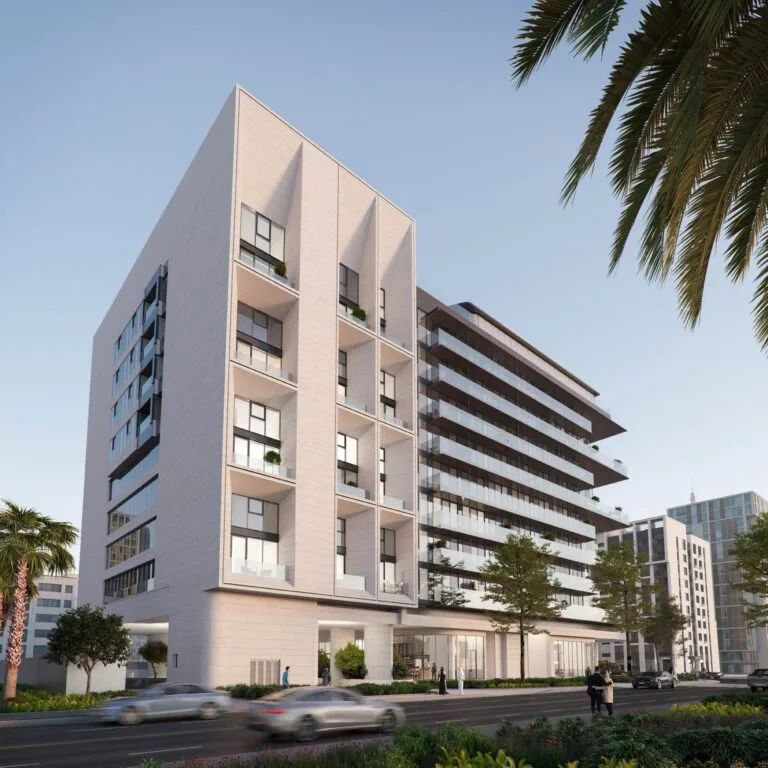
1. Definition of the area and data structure
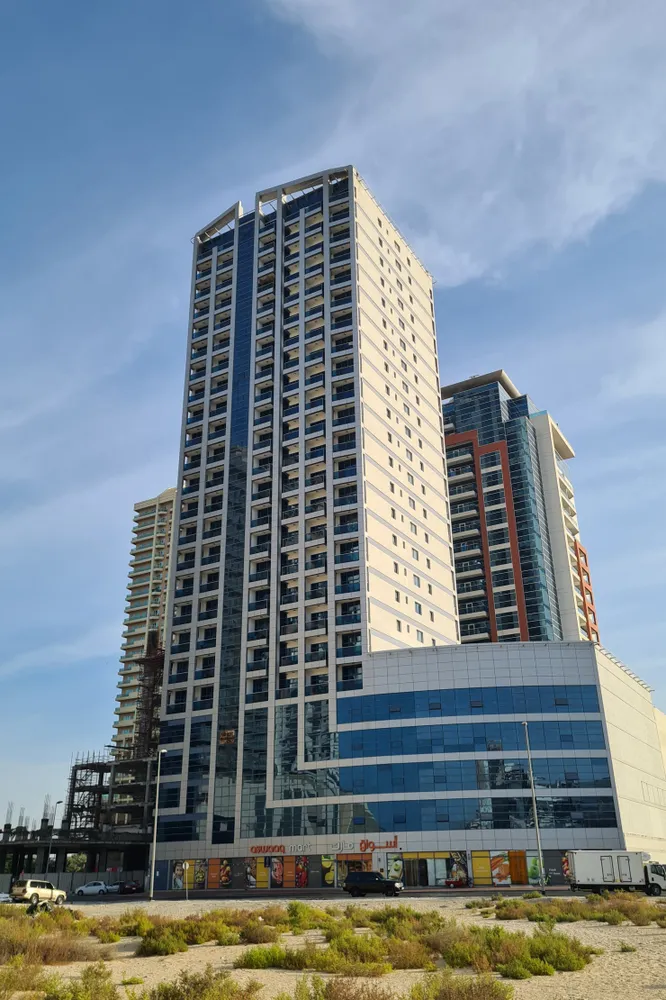
Actual location: according to DLD, Sydney Tower is located in Al Barsha South Fourth, within the Jumeirah Village Circle master project. These specific area and master-project values are used for comparison and benchmark building.
There is sufficient sales data for 1-bedroom apartments in Sydney Tower (59 transactions), while rental analysis is only possible at the district level (there is not a single confirmed rental contract for this building in the database).
2. Sales dynamics and asset liquidity
Sydney Tower (1-bedroom apartments) demonstrates stable liquidity: from 2023 to the present (only completed periods were considered; future-dated deals were excluded), transactions have taken place every quarter, with 1 to 13 sales recorded per quarter. The average size of apartments sold is 67 m² (range: 62–74 m²).
Average price per m² dynamics for Sydney Tower:
– 2023: from 10,077 to 11,289 AED/m² (quarter-on-quarter);
– 2024: range of 11,277–12,295 AED/m²;
– early 2025: growth to 13,224 AED/m² in the last quarter.
The 12‑month average for the building: 12,541 AED/m² (1-bedroom apartments).
The district backdrop (Al Barsha South Fourth) is slightly higher: over the last 12 months — 14,161 AED/m² (1-bedroom apartments). Note also the wide but still market-consistent price range within the building itself (from 6,682 to 13,707 AED/m²), which at times reflects differences in layouts, floor levels or the specifics of individual deals.
3. Rental market and rates
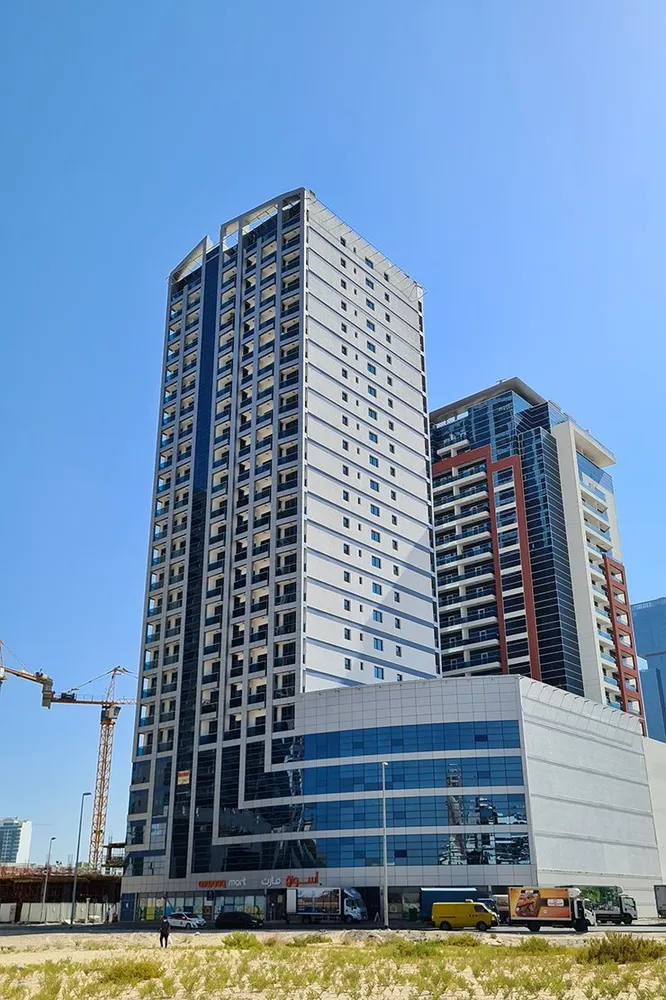
For Sydney Tower itself, no DLD-registered rental contracts for 1-bedroom apartments have been recorded at all. This is typical for new (off-plan) buildings right after handover — units gradually enter the secondary rental market.
The situation in Al Barsha South Fourth is different: more than 115,000 contracts have been recorded over the entire period. The average annual rental rate per m² (for all residential apartments) shows a clear upward trend:
– 2023: 745–812 AED/m²;
– 2024: 849–967 AED/m² by quarter.
Over the last 12 months, the average rental level in the district amounted to 1,013 AED/m². It is evident that the district’s rental market remains dynamic, with sufficiently strong demand.
4. Yield (ROI) and investment price range
Since there are no rental contracts for the building itself, a reliable yield indicator can only be calculated at the district level:
– Average purchase price of a 1BR apartment in the district — 14,161 AED/m²;
– Average rent over the same period — 1,013 AED/m²;
– Gross yield for the district: 7.15% per annum;
– After accounting for entry costs (around 7%): net ROI ~6.7% per annum.
Fair range for an investor targeting a 7–8% ROI:
– At a rental level of 1,013 AED/m², a fair purchase price for 7–8% ROI is 12,660–14,470 AED/m².
– Sydney Tower is trading right at the lower boundary of this range (12,541 AED/m²), which makes it a relatively attractive entry point for an investor.
5. Liquidity and market outlook
– Sydney Tower is a liquid building with a healthy flow of transactions on the secondary sales market.
– The price per m² in the building is noticeably lower than the district average (a discount of 10–15%), which can be used by an investor to build in an additional yield buffer.
– The district has a high share of rental stock, and the steady growth in rental rates is confirmed by a large sample size and strong contract dynamics.
– Investments in Sydney Tower over a 3–5 year horizon look attractive for an investor targeting an average ROI, especially if, as the building enters the rental market, the apartment is leased out consistently.
– Risks — further price growth may compress yields for new buyers, and the recovery of the rental market specifically for this building depends on the pace of occupancy and the reputation of the property.
6. Brief conclusion
Sydney Tower (1-bedroom apartments) is selling below the district average, while the Al Barsha South Fourth segment as a whole provides solid benchmarks for rental levels and stable liquidity. The asset is worth considering as an investment targeting a 6.5–7% net ROI under a medium-term rental strategy, with caution regarding further capital appreciation and rental rate growth. Any formal revaluation or guarantees are impossible — the calculations are based solely on averaged actual DLD data.
Related Articles
- How to sell an apartment in Dubai in The Bay – analysis 2025 — 01.12.2025
- How to sell an apartment in Dubai in Royal Continental Suites – analysis 2025 — 28.11.2025
- How to sell an apartment in Dubai in Al Murad Tower – analysis 2025 — 28.11.2025
- ROI analysis of apartment in Skyvue spectra: DLD data and real deals — 28.11.2025
- ROI analysis of apartment in Cayan Tower: DLD data and real deals — 28.11.2025
PDF shortlist · updated 27 October 2026
Top Dubai areas by rental yield: projects to buy
28 projects · area yields from DLD and Ejari data
28 more in the PDF: prices, handover dates, payment plans
The PDF opens instantly. Refreshed monthly from DLD data.