For residential Unit and Villa transactions registered from 2021 to 23 October 2026, Emaar recorded 95,515 sales and Damac recorded 37,804. In 2025, Emaar accounted for 19,363 transactions, or 10.6% of comparable Dubai sales, against Damac’s 9,805 transactions and 5.4%. Emaar’s 2025 median price was AED 23,864 per m², while Damac’s was AED 16,125 per m²; the difference also reflects a different mix of apartments, villas and bedroom counts.
Emaar vs Damac: side-by-side figures from registered residential transactions
This comparison uses registered Sales transactions for residential Units and Villas only. It excludes commercial properties, plots, transactions outside the stated price and value filters, and records without a positive area. Prices are medians rather than averages, so a limited number of very high-value transactions has less effect on the result.
The transaction register does not contain a “developer” field. Transactions were therefore matched to Dubai Land Department project numbers in the project catalogue. The Emaar list includes projects registered to Emaar legal entities and relevant joint-venture or project-company registrations; the Damac list follows the same approach. The resulting selection contains 345 Emaar projects and 239 Damac projects.
| Measure | Emaar | Damac |
| Projects in the DLD project register | 345 | 239 |
| Projects with residential transactions, 2021–2026 | 273 | 126 |
| Residential transactions, 2021–23 Oct 2026 | 95,515 | 37,804 |
| Transactions in 2025 | 19,363 | 9,805 |
| Share of comparable Dubai transactions, 2025 | 10.6% | 5.4% |
| Share of comparable Dubai transactions, 2026 to 23 Oct | 8.5% | 7.1% |
| Median price per m², 2025 | AED 23,864 | AED 16,125 |
| Median price per m², 2026 to 23 Oct | AED 24,759 | AED 19,069 |
| Median transaction price, 2025 | AED 2,911,888 | AED 1,230,000 |
| Median transaction price, last 12 months to 23 Oct 2026 | AED 2,783,888 | AED 1,859,000 |
| Off-plan share of transactions, 2025 | 68.3% | 70.3% |
| Existing-property share, 2025 | 31.7% | 29.7% |
| Finished projects | 191 | 128 |
| Active projects under construction | 140 | 79 |
| Cancelled projects | 14 | 32 |
| Median completion of active projects | 9.4% | 8.2% |
| Lowest area median, 2025–2026 | AED 14,831 per m² | AED 8,681 per m² |
| Highest area median, 2025–2026 | AED 37,714 per m² | AED 34,565 per m² |
The full project selections can be reviewed in the Emaar project directory and the Damac project directory. The figures above are not a quality ranking and do not measure construction standards, management, handover timing, developer finances or investor returns.
PDF shortlist · updated 27 October 2026
New Dubai projects of October 2026
30 projects · prices from DLD and developers
-
 Rise By Athlon 1 Wadi Al Safa 5 · 1–3 BR
from AED 1,412,000
-
 Zuha Island Villas World Islands
from AED 68,000,000
-
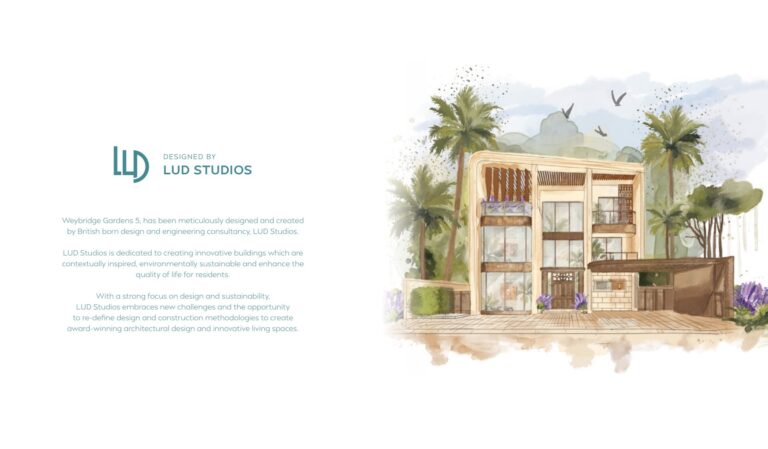 Weybridge Gardens Phase 5 by Leos Developments Dubailand Oasis
from AED 756,782
27 more in the PDF: prices, handover dates, payment plans
The PDF opens instantly. Refreshed monthly from DLD data.
Transaction volumes and market share by year
Emaar had more registered residential transactions than Damac in every year from 2021 through 23 October 2026. The gap in absolute numbers was widest in 2024, when Emaar registered 22,751 transactions against Damac’s 7,833. By 2026 to date, the difference had narrowed in transaction count: 9,650 Emaar sales and 8,062 Damac sales.
| Year | Emaar transactions | Emaar share of Dubai | Damac transactions | Damac share of Dubai | Comparable Dubai transactions |
| 2021 | 9,038 | 19.1% | 2,074 | 4.4% | 47,333 |
| 2022 | 15,439 | 20.5% | 3,905 | 5.2% | 75,335 |
| 2023 | 19,274 | 17.6% | 6,125 | 5.6% | 109,622 |
| 2024 | 22,751 | 14.5% | 7,833 | 5.0% | 156,482 |
| 2025 | 19,363 | 10.6% | 9,805 | 5.4% | 183,060 |
| 2026 to 23 Oct | 9,650 | 8.5% | 8,062 | 7.1% | 114,050 |
Emaar’s share fell from 20.5% in 2022 to 10.6% in 2025, while the number of Dubai transactions rose from 75,335 to 183,060. On these filters, this means the city market grew faster than Emaar’s registered transaction volume. Damac’s share moved from 5.2% in 2022 to 5.4% in 2025, then reached 7.1% in the incomplete 2026 period.
The 2026 row should not be read as a full-year comparison. It covers registrations through 23 October only, and registrations are recorded by transaction registration date rather than by the date a buyer decided to purchase.
For the city-wide figures used as the denominator, readers can check Dubai property prices and transactions using the same residential transaction scope.
Price per square metre: Emaar, Damac and Dubai
For searches such as “Damac vs Emaar price per sqft”, the comparable registered measure here is AED per m². No conversion to square feet is used in this page because all medians are kept in the registry’s area basis.
| Year | Emaar median AED per m² | Damac median AED per m² | Dubai median AED per m² |
| 2021 | 16,348 | 10,845 | 11,055 |
| 2022 | 19,200 | 13,776 | 13,902 |
| 2023 | 21,147 | 17,008 | 15,247 |
| 2024 | 23,298 | 15,500 | 16,753 |
| 2025 | 23,864 | 16,125 | 18,159 |
| 2026 to 23 Oct | 24,759 | 19,069 | 18,418 |
In 2025, Emaar’s median was AED 5,705 per m² above the Dubai median, while Damac’s was AED 2,034 per m² below it. By 23 October 2026, Emaar’s median was AED 24,759 per m² and Damac’s was AED 19,069 per m². Both were above the comparable Dubai median of AED 18,418 per m².
The 12-month median ending 23 October 2026 was AED 24,474 per m² for Emaar and AED 18,661 per m² for Damac. A developer-wide median is a description of the sold mix, not a fixed price list. It combines different locations, property types, sizes and project stages.
Median transaction price and the effect of unit mix
The median transaction price was AED 2,911,888 for Emaar and AED 1,230,000 for Damac in 2025. That does not mean every comparable Emaar home was priced more highly than every comparable Damac home. It indicates that the middle transaction in each developer’s registered 2025 distribution had a different value.
| Year | Emaar median transaction price | Damac median transaction price |
| 2021 | AED 2,207,802 | AED 819,000 |
| 2022 | AED 2,100,000 | AED 927,500 |
| 2023 | AED 2,335,888 | AED 1,451,487 |
| 2024 | AED 2,717,888 | AED 1,194,000 |
| 2025 | AED 2,911,888 | AED 1,230,000 |
| 2026 to 23 Oct | AED 2,625,000 | AED 2,486,000 |
For the latest 12-month period, the respective medians were AED 2,783,888 and AED 1,859,000. The movement in Damac’s median between the 2025 calendar year and the later 12-month period should be read alongside the changing proportion of off-plan and existing-property records, as well as the size and bedroom mix of homes sold.
This comparison records only residential Unit and Villa transactions, which is why the Emaar total here is 19,363.
Studios, one-bedroom homes and villas: what was actually sold
The 2025–2026 transaction mix differs materially. Studios made up 0.5% of Emaar’s recorded sales and 14.0% of Damac’s. One-bedroom homes represented 31.8% of Emaar transactions and 45.7% of Damac transactions.
| Property type, 2025–23 Oct 2026 | Emaar transactions | Emaar share | Damac transactions | Damac share |
| Studio | 148 | 0.5% | 2,501 | 14.0% |
| One bedroom | 9,230 | 31.8% | 8,173 | 45.7% |
| Two bedrooms | 9,002 | 31.0% | 2,410 | 13.5% |
| Three bedrooms or more, apartments | 3,130 | 10.8% | 366 | 2.0% |
| Villas and townhouses | 7,503 | 25.9% | 4,417 | 24.7% |
| Total | 29,013 | 100% | 17,867 | 100% |
Villas and townhouses formed a similar share: 25.9% for Emaar and 24.7% for Damac. The main difference is in apartments. Excluding villas and townhouses, Emaar’s apartment transactions were 42.9% one-bedroom and 41.9% two-bedroom. Damac’s apartment transactions were 60.8% one-bedroom, 18.6% studios and 17.9% two-bedroom.
This composition helps explain why median deal values and median price per m² should not be treated as a direct comparison of identical homes. Emaar’s registered mix had a larger share of two-bedroom apartments and apartments with three or more bedrooms. Damac’s had a higher share of studios and one-bedroom units.
Price range between Dubai areas
Area-level medians show a broad range for both developer selections. Only areas with at least 100 residential transactions between 2025 and 23 October 2026 are included in this comparison.
For Emaar, the lowest area median was AED 14,831 per m² in Wadi Al Safa 7, identified with Arabian Ranches II in the project register. The highest was AED 37,714 per m² in Marsa Dubai, identified with Dubai Harbour. The difference between those medians was about 2.5 times.
Emaar also recorded medians of AED 15,023 per m² in Al Yufrah 1, AED 25,917 per m² in Hadaeq Sheikh Mohammed Bin Rashid, AED 26,749 per m² in Al Khairan First and AED 31,446 per m² in Burj Khalifa. These are area medians within the matched project list, not city-wide medians for each district.
For Damac, the lowest area median was AED 8,681 per m² in Me’Aisem First, identified with International Media Production Zone. The highest was AED 34,565 per m² in Marsa Dubai, identified with Dubai Harbour. The difference between these two figures was about 4.0 times.
Damac’s other recorded area medians included AED 9,815 per m² in Al Barsha South Fourth, AED 12,743 per m² in Madinat Hind 4, AED 16,156 per m² in Al Hebiah Third, AED 19,699 per m² in Al Hebiah Fifth and AED 33,597 per m² in Madinat Dubai Almelaheyah.
For a buyer comparing Emaar or Damac by budget, the area range matters more than a single developer-wide median. A lower median in one district does not establish a lower price for every unit there, and a higher district median does not establish a higher price for every floorplan or building.
Finished projects, active projects and recorded completion levels
The project register lists 191 finished Emaar projects and 128 finished Damac projects. It lists 140 active Emaar projects and 79 active Damac projects. Finished means a recorded completion level of 100%.
| Project status | Emaar | Damac |
| Total projects | 345 | 239 |
| Finished, 100% completion | 191 | 128 |
| Active | 140 | 79 |
| Cancelled | 14 | 32 |
| Median completion of active projects | 9.4% | 8.2% |
| Finished share excluding cancelled projects | 57.7% | 61.8% |
The median recorded completion level for active projects was 9.4% for Emaar and 8.2% for Damac. This is a snapshot across all projects carrying active status, rather than a handover date for any specific building.
The register status is useful for separating finished and active project records in a transaction analysis. It does not provide a basis here for statements about construction quality, contractual terms or the outcome of a particular purchase. Those depend on the individual project and transaction documentation.
Off-plan, existing properties and the resale question
In 2025, off-plan transactions represented 68.3% of Emaar’s registered sales and 70.3% of Damac’s. Existing-property transactions represented 31.7% and 29.7%, respectively.
| Year | Emaar off-plan | Emaar existing | Damac off-plan | Damac existing |
| 2021 | 66.4% | 33.6% | 30.9% | 69.1% |
| 2022 | 69.3% | 30.7% | 40.0% | 60.0% |
| 2023 | 65.6% | 34.4% | 51.1% | 48.9% |
| 2024 | 71.6% | 28.4% | 62.6% | 37.4% |
| 2025 | 68.3% | 31.7% | 70.3% | 29.7% |
| 2026 to 23 Oct | 61.8% | 38.2% | 82.5% | 17.5% |
For searches about Emaar vs Damac resale value, the available registry measure is the Existing Properties share. It can serve as an indirect indicator of activity in ready-property transactions, but it is not an exact resale rate. Existing-property records include resales and first sales of completed units by the developer, and the two cannot be separated in this transaction set.
Across 2025 and the 2026 period to 23 October combined, the existing-property share was 33.8% for Emaar and 24.2% for Damac. That describes the registration mix in the selected projects. It does not measure profit, resale price growth, time on market or the ease of selling a particular apartment or villa.
Which buyer profile is reflected in the transaction data?
The numbers describe transaction patterns rather than a recommendation. A buyer looking at a higher developer-wide median price per m² and a greater recorded share of two-bedroom, larger-apartment and villa or townhouse transactions would more often encounter Emaar projects in this dataset. Emaar’s 2025 median transaction value was AED 2.91 million, and 25.9% of its 2025–2026 sales were villas or townhouses.
A buyer looking at a lower 2025 developer-wide median price per m², a larger share of studios and a larger share of one-bedroom apartments would more often encounter Damac projects in this dataset. Damac’s 2025 median transaction value was AED 1.23 million, with studios and one-bedroom homes accounting for 59.7% of its 2025–2026 registered residential transactions.
There is overlap. Both selections include villa and townhouse transactions at close to one quarter of their recorded volume, and both contain areas with much higher and much lower price-per-m² medians. The project, district, unit size, registration type and purchase date remain necessary variables for any individual comparison.
Frequently asked questions
Which developer suits which buyer?
This transaction comparison does not rank developers. It shows that Emaar had more registered residential sales and a higher median price per m² in 2025, while Damac had a higher share of studios and one-bedroom transactions.
Does the data compare Emaar and Damac quality?
No. The registry records transaction and project-status data, not construction quality, maintenance quality or buyer satisfaction.
Which had more sales in 2025?
Emaar recorded 19,363 residential Unit and Villa transactions, compared with 9,805 for Damac.
Why is Emaar’s market share lower in 2025 than in 2022?
Emaar’s share was 20.5% in 2022 and 10.6% in 2025, while comparable Dubai residential transactions rose from 75,335 to 183,060. The city market grew faster than Emaar’s transaction volume during that period.
Does Existing mean every sale was a resale?
No. Existing Properties includes resales and first sales of completed homes. The transaction records used here do not separate those two categories.
Does this page cover oqood?
Oqood is not presented as a separate transaction category in this comparison. The analysis separates registered sales into off-plan and Existing Properties records.
Why do Emaar transaction totals differ from other Emaar sales figures?
This page counts only residential Units and Villas under the stated transaction filters. Figures that include all sales, including non-residential records, can be higher.
PDF shortlist · updated 27 October 2026
New Dubai projects of October 2026
30 projects · prices from DLD and developers
30 more in the PDF: prices, handover dates, payment plans
The PDF opens instantly. Refreshed monthly from DLD data.