1. Definition of the area and data structure
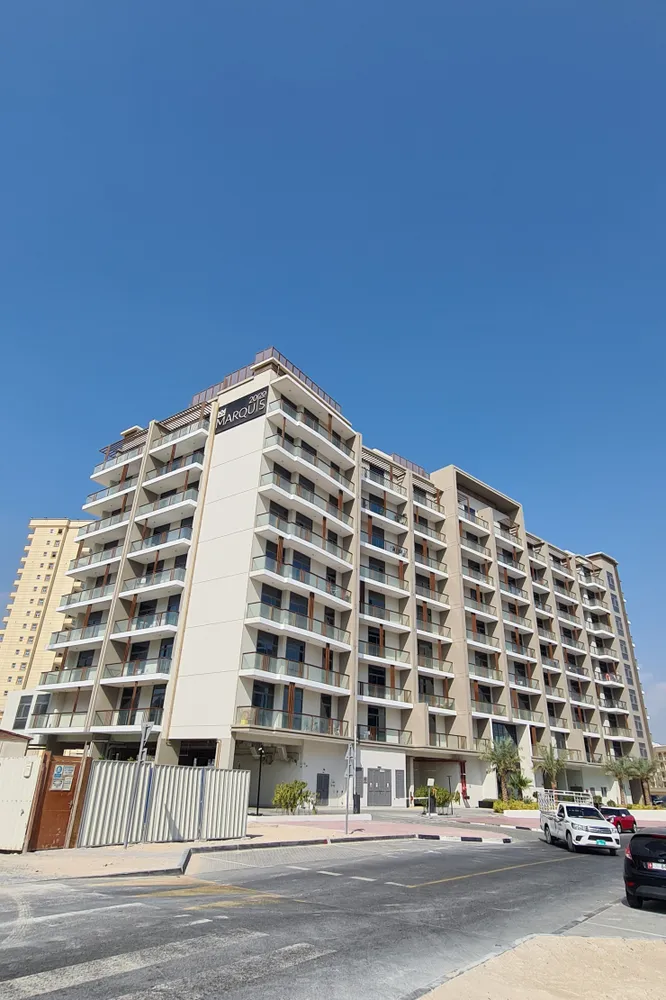
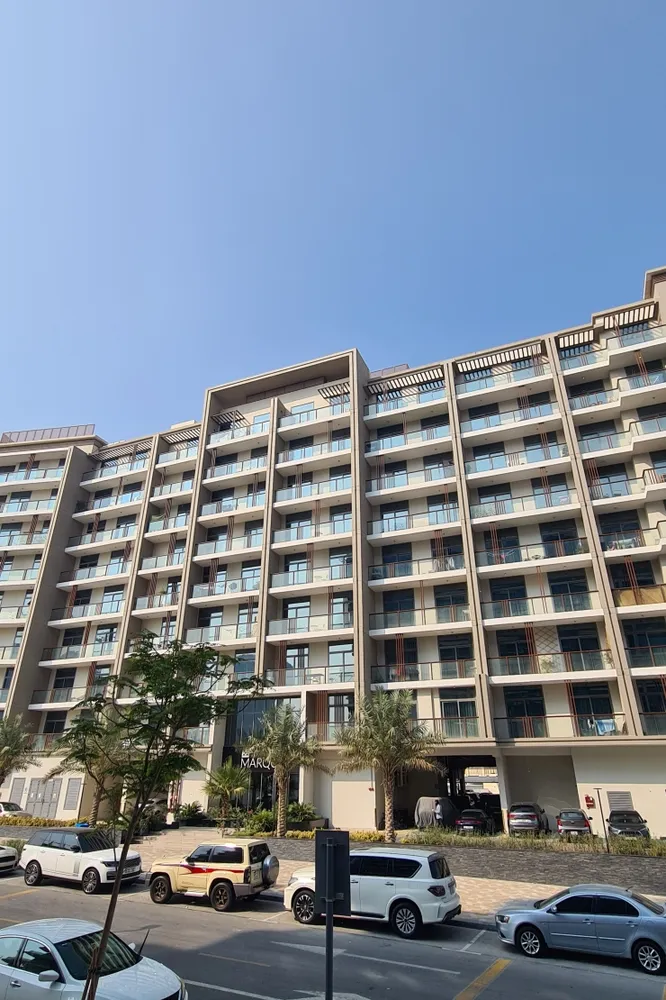
Actual location: according to DLD, the building 2020 Marquis belongs to Al Barshaa South Third, master project Arjan. All analytics are based on the dynamics and prices of this specific building, and are also compared with the average indicators for the area.
Data volume: for this building, more than 260 sale transactions have been recorded (since 2021), and around 335 unique rental contracts are formally registered as apartments (Flat) with valid parameters for area and annual rent. This is a sufficiently liquid asset for both types of analysis, and the building can be confidently compared with the overall benchmark of the area.
2. Dynamics of volume and liquidity
Sales:
– The main phase of active transactions occurred in 2021 (Q2–Q3) and 2022, which is typical for new projects in Arjan.
– Each quarter of 2021 saw between 14 and 45 transactions, after which the pace somewhat slowed (2–8 per quarter in 2023), followed by a new spike in activity as the building was handed over and new owners were registered.
– Over the past 12 months, transactions have also been recorded in the building, indicating ongoing market activity.
Rentals:
– The number of rental contracts for the building allows us to judge the real demand and popularity of the asset among tenants, even though a significant share of the contracts may relate to the first years of operation.
3. Price dynamics for the building and the area
Price per square metre in 2020 Marquis (average across all transactions):
– From 2021 to the first half of 2024 there has been a steady increase in the average price per square metre — from 8,500–9,500 dirhams (2021) to 11,000–12,000 dirhams (2024).
– However, individual peaks can be explained by the registration of late instalments and final payments at the handover stage.
– Over the last 12 months, the weighted average price per square metre in 2020 Marquis was about 11,256 AED/m².
For comparison, in Al Barshaa South Third:
– Over the same period, the average price in the area is significantly higher: 15,152 AED/m² over the last 12 months.
– Since 2021, the area has also shown positive dynamics, with the average price gradually increasing from 10,000–11,000 to 13,000–15,000+ AED/m².
As a result, over the past year 2020 Marquis has been selling at a price roughly 26% below the area average.
4. Rental dynamics for the building and the area
According to DLD:
– The average annual rent in 2020 Marquis over the last 12 months was 932 AED/m² per year (based on valid Flat, Residential contracts).
– The average rental rate in Al Barshaa South Third is similar — 942 AED/m² per year.
– There are no significant differences between the building and the area in terms of average rental levels, which confirms that the rental rates in the building are fair.
Quarterly rental dynamics:
– In 2021, rates in Marquis were at the level of 500–600 AED/m², then grew steadily — 700+ AED/m² by 2023 and 800–960+ AED/m² in 2024.
– The area shows a similar trend, but with a less pronounced range: a smooth increase from 550–600 to 800–870 AED/m², with recent quarters at around 860–870 AED/m².
5. Market yield (ROI) and fair price range
Yield calculation based on actual DLD contracts (last 12 months):
For the building:
– Average purchase price: ~11,256 AED/m².
– Average rent: ~932 AED/m²/year.
– Gross yield (ROI_brutto): 932 / 11,256 ≈ 8.3%.
For the area:
– Average purchase price: ~15,152 AED/m².
– Average rent: ~942 AED/m²/year.
– Gross yield (ROI_brutto): 942 / 15,152 ≈ 6.2%.
Net annual yield for an investor (ROI_net), taking into account typical transaction costs (registration, brokerage fee, other expenses of about 7%):
– For the building: ROI_net ≈ 8.3% / 1.07 ≈ 7.8% per annum.
– For the area: ROI_net ≈ 6.2% / 1.07 ≈ 5.8% per annum.
For an investor targeting a typical yield of 7–8% per annum, the “fair” purchase price range for a buy-to-let property is:
– For the building: 932 / 0.08 = 11,650 AED/m² (for 8% ROI), 932 / 0.07 = 13,314 AED/m² (for 7% ROI).
– The current building average is slightly below the fair range for 7%, and close to the lower bound for 8%. This means that the current price in 2020 Marquis looks fair for a buy-to-let investor and can deliver the target yield of 7–8% even without an additional discount. In contrast, the average price level in the area is already inflated: to reach a net yield of 7–8% in the area, either a substantial discount to the current price (~13,000 AED/m²) is required, or further rental growth needs to materialise.
6. Final conclusions on liquidity and outlook
– 2020 Marquis is an asset with stable liquidity and market demand, as confirmed by the volume of both sales and rental transactions.
– The average price per square metre in the building over the last 12 months is about 26% below the area average, which makes it an attractive price option for new investors.
– At current purchase levels, yields can reach 7.8% per annum including all costs — this is above the area average and comparable to the upper bound of the “fair” yield range for a new investor.
– Capital growth over the past 3 years has been substantial, but the potential for outperformance versus the area may be limited as the building reaches a mature operating phase and prices converge towards the market average.
– For an investor focused on rental income with transparent yields and minimised price risk, 2020 Marquis currently offers one of the best price–yield balances in Arjan/Al Barshaa South Third.
Related Articles
- How to buy a property in Dubai in Oakley Square Residences – analysis 2026
- ROI analysis of apartment in MARINASCAPE: DLD data and real deals
- ROI analysis of apartment in Park Central: DLD data and real deals
- How to buy a home in Dubai in Parkviews – analysis 2026
- ROI analysis of apartment in SUNSHINE RESIDENCE: DLD data and real deals