
1. Defining the area and data structure
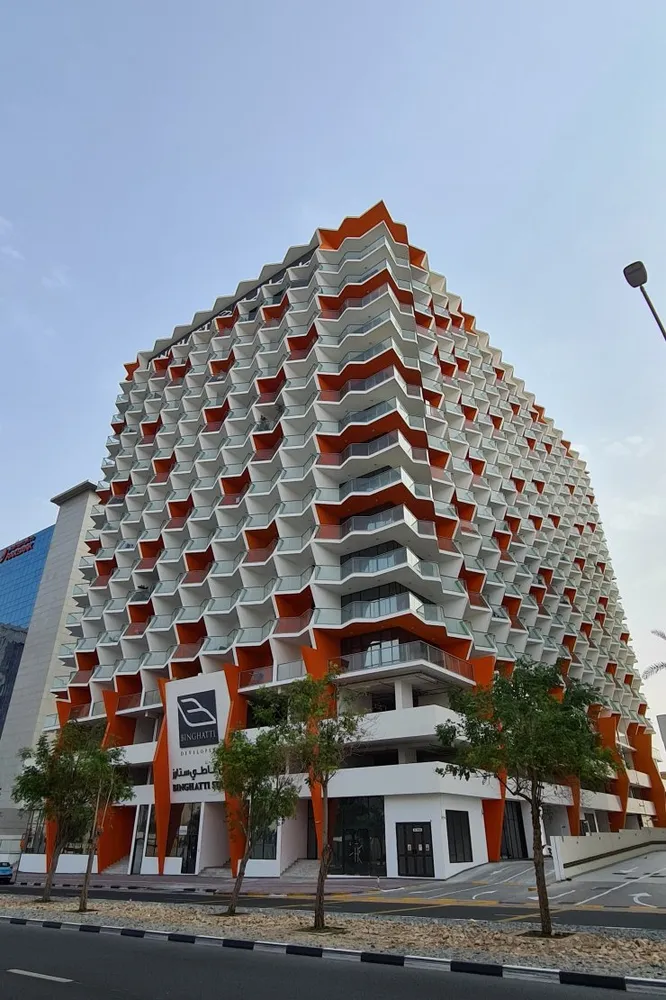
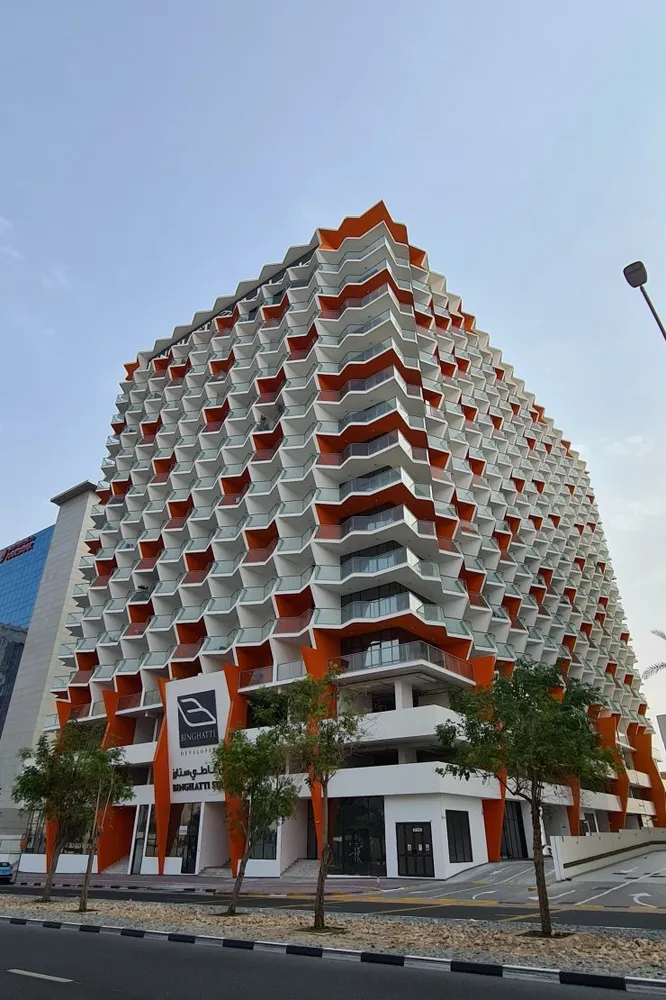
The Binghatti Stars building is located in the Nadd Hessa area, within the Silicon Oasis master project. This naming linkage has been confirmed through a direct selection of transactions for this asset; in the DLD database it appears exactly in this way. There is a sufficient volume of transactions for a full-scale analysis of this building: 117 transactions for 1BR apartments from 2020 to the present.
2. Liquidity, transaction frequency, price and size ranges
For Binghatti Stars (1 bedroom), 117 transactions have been recorded, which indicates stable liquidity and sustained demand on the secondary market. The average size of 1BR apartments ranges from 82 to 133 m², while the price spread per m² in actual deals is from 2,300 to 10,300 AED/m² (with the main cluster of recent transactions in the 6,300–8,000 AED/m² range). Deals are recorded in almost every quarter, reflecting a constant level of buyer interest.
3. Price per m² dynamics for the building and the area
Binghatti Stars:
– 2020–2021: price per m² in the range of 4,250–5,400 AED/m², a decline by mid‑2021 followed by a gradual increase.
– 2022–2023: a confident upward trend began (up to 5,900–6,300 AED/m²).
– From 2024 there has been a sharp increase: the average price in the latest transactions is 7,200–8,000 AED/m².
– Over the last 12 months the average price has been 7,660 AED/m² (16 transactions).
Nadd Hessa area (all apartments):
– In 2020–2021 the average price remained at 5,800–7,100 AED/m².
– In 2023 it grew to 7,300–7,800 AED/m², and then a sharp acceleration followed — over the last 12 months the area average has already reached 14,440 AED/m² (3,723 transactions), driven by the launch of new (more expensive) Silicon Oasis projects and a general re‑rating of the area.
Thus, Binghatti Stars is selling at almost half the average level for Nadd Hessa, which reflects its “budget” positioning relative to the new stock in the area.
4. Rentals: dynamics, average level, ranges
There are no direct rental contracts for Binghatti Stars (1BR) in the DLD. Therefore, for rental analysis we use the Silicon Oasis master project and the Nadd Hessa area, where more than 13,800 contracts have been recorded over the last 12 months:
– Area dynamics: in 2020 the average rate was around 500–580 AED/m²/year; in 2021–2022 it grew gradually (550–600 AED/m²/year), and from late 2022 growth accelerated: in 2023–2024 one‑off peaks reached 730–750 AED/m²/year.
– Over the last 12 months the average rent for the area and master project is 737.5 AED/m²/year (a very large volume of contracts, so the figures are robust).
– This is an objective benchmark applicable to typical 1BR units of a similar class in Silicon Oasis.
5. Yield and fair price (ROI, “fair range” for an investor)
– Average purchase price per m² for Binghatti Stars (1BR) — 7,660 AED/m²; for the area — 14,440 AED/m².
– Average annual rent per m² — 737.5 AED.
– Gross yield (ROI) for Binghatti Stars: 9.6% per annum (737.5 / 7,660).
– Gross yield for the area: 5.1% (737.5 / 14,440).
Taking into account entry costs (7–8%), the actual (net) yield for Binghatti Stars is 8.9–9.0% per annum, and for the area — 4.7–4.8%.
Fair price for an investor targeting 7–8% per annum: the fair level for the “8% formula” is 9,220–10,530 AED/m². In the current market Binghatti Stars is available at a noticeable discount, meaning the investor gains either upside potential or a safe entry level.
6. Conclusions and outlook
Binghatti Stars is a clearly defined “value” segment within Silicon Oasis: high rentability, a stable flow of transactions, and a decent spread of unit sizes. In the market structure of the last two years, the area has appreciated significantly due to the launch of expensive new projects, which pushed the average price up, while Binghatti Stars has retained critically high yields compared to most competitors in the area.
Liquidity for the building is excellent — up to 16 1BR transactions per year in just the last 12 months, and the rental market is highly liquid (tens of thousands of contracts in the base area). The building remains an attractive entry point for an investor seeking yields above the area average, and a compelling option for a quick resale (the “spread” between the building and the area is clearly intact). Over a 3–5 year horizon, an investor here can expect either a strong net cash flow with stable leasing, or likely capital appreciation as prices for older and newer stock converge.
Related Articles
- ROI analysis of apartment in Beverly Boulevard: DLD data and real deals
- How to buy an unit in Dubai in Naya 3 – analysis 2026
- ROI analysis of apartment in Binghatti Tulip: DLD data and real deals
- How to sell an unit in Dubai in Sadaf 8 – analysis 2026
- ROI analysis of apartment in Oxford Terraces 2: DLD data and real deals
