1. Definition of the area and data structure
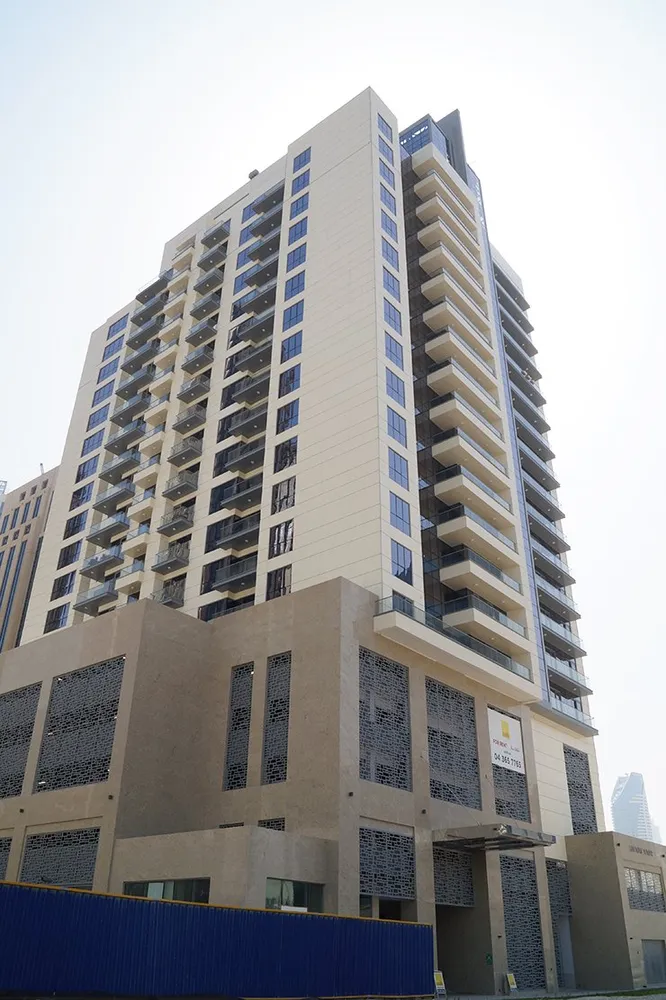
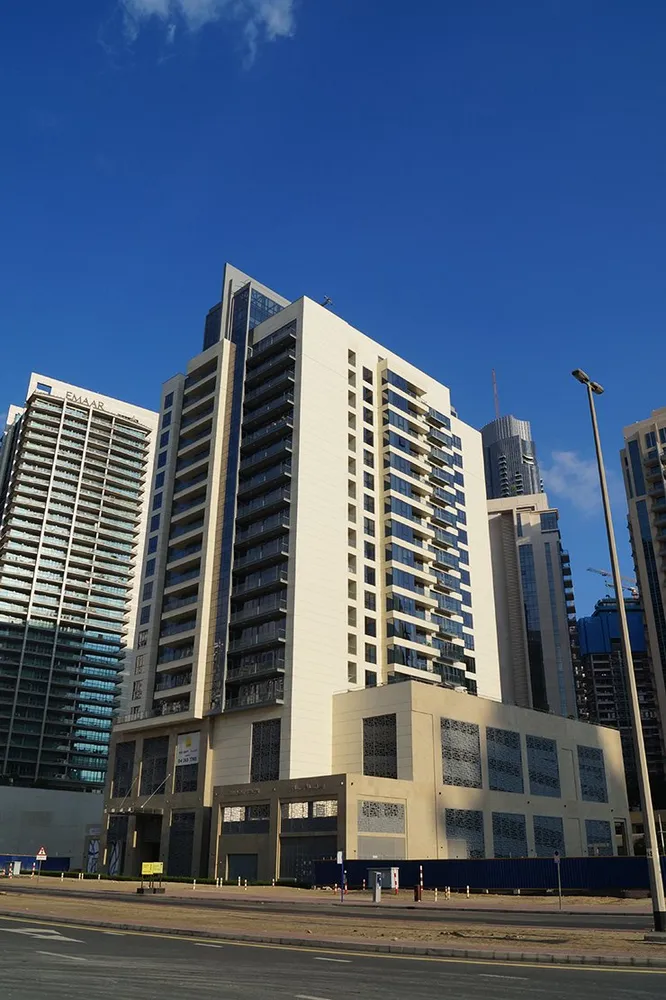
Actual location: BAHWAN TOWER is confirmed in DLD data as a property in the Burj Khalifa area, master project DownTown Dubai. All subsequent area benchmarks are based on this classification.
Data volume and structure: 261 sales in this building are recorded in DLD. As for rentals in this building (and even within the DownTown Dubai master project), DLD has not registered a single valid lease contract in recent years either for 1-bedroom units or for the building as a whole – only aggregated rental data for the wider Burj Khalifa area.
2. Sales dynamics and price levels
Transaction frequency and liquidity: For 1-bedroom apartments in BAHWAN TOWER there has been stable sales activity from 2020 to 2025: in a number of quarters between 1 and 26 deals were closed, which indicates good liquidity for this asset class.
Dynamics of the average price per m² in the building (1-bedroom apartments):
Since 2020, the average price per square metre in concluded deals has increased from about AED 8,600 to over AED 15,000. The following stages stand out:
– 2020–2022: Gradual growth from ~AED 8,500/m² (end of 2020) to ~AED 11,600/m² (2022).
– 2023: Sharp acceleration in growth — values reach AED 13,700–16,000/m².
– 2024 (last 12 months): The average transaction price in the building is AED 16,130/m².
Burj Khalifa area for the same representative deals (apartments 35–150 m²): Prices are consistently much higher: over the last 12 months — AED 23,726/m². The gap between BAHWAN TOWER and the area average is around 32%, i.e. BAHWAN TOWER is significantly cheaper than the average apartment in Burj Khalifa.
3. Rentals: dynamics and rate levels
There are no valid data for concluded lease contracts in this building either for 1-bedroom units or for the building/master project as a whole. Therefore, it is impossible to calculate any rental yield metrics or to provide rental rate guidance based strictly on DLD for this specific property.
For the Burj Khalifa area as a whole: Contract activity is consistently high — about 52,600 lease agreements for all residential properties over the entire period.
– Over the last 12 months the average rent is AED 1,598/m²/year.
– Dynamics since 2020: Growth from AED 810/m²/year in 2020 to above AED 1,500/m²/year in 2024.
4. Comparison of prices and yields for the building and the area, fair value analysis
The average sale price of 1-bedroom units in BAHWAN TOWER over the last 12 months is noticeably below the Burj Khalifa area average — AED 16,130 versus AED 23,726/m².
Rental rates cannot be used to calculate profitability for this specific building due to the absence of recorded rental deals; we can only rely on average rates for the area.
Gross yield for the area (simple arithmetic): ROI_brutto = 1,598 / 23,726 = 6.7%
For BAHWAN TOWER at the same rental rate (which in reality is not always correct, since the building is cheaper and we have no rental data!): ROI_brutto ~ 9.9%
Net yield (adjusting for entry costs of ≈7%): ROI_net_home ~ 9.2%, ROI_net_area ~ 6.2%.
Important: due to the lack of confirmed rental deals for the building, these values are valid only at the area level and cannot be treated as guaranteed for a specific apartment in BAHWAN TOWER.
Investor fair price range (for a target ROI of 7–8%) based on area figures: 1,598 / 0.08 = AED 19,975/m²; 1,598 / 0.07 = AED 22,829/m². Based on current market transactions, your building is still trading below these thresholds.
5. Conclusions on liquidity, dynamics and investment outlook
BAHWAN TOWER is a liquid residential asset with an established sales track record; apartment prices have been rising since 2020, with a substantial discount to the wider area. In terms of pricing, the building is noticeably cheaper than the Burj Khalifa average, which may mean a lower entry risk for an investor. However, the absence of DLD-registered lease contracts for the building itself limits the ability to forecast and guarantee rental returns — one can only rely on the area’s average rental levels.
The Burj Khalifa area demonstrates steadily growing rental demand and a consistent upward trend in both prices and rental rates. For a long-term investor, BAHWAN TOWER is a budget-friendly alternative to the top assets in the location, but any rental yield forecast must be made with considerable caution.
Related Articles
- How to sell an unit in Dubai in Artesia A – analysis 2026
- How to sell a property in Dubai in Trinity by Karma – analysis 2026
- ROI analysis of apartment in Grande: DLD data and real deals
- ROI analysis of apartment in Elite 5 Sports Residence: DLD data and real deals
- How to sell a home in Dubai in Park Residences – analysis 2026